

Many parametrizations of sub-grid physical processes within the Integrated Forecasting System (IFS) contain optimised parameters traditionally derived through statistical fits to observations. Many of these parameters cannot be observed directly and are therefore pragmatically adjusted to improve forecast performance. Using operationally available data assimilation increments, we have developed a workflow within the IFS that exploits these increments to optimise selected land-surface model parameters and improve the forecast quality of near-surface variables.
The challenge of optimising land-surface parameters
Many land-surface parameters describe physical processes that are difficult to observe directly, such as transpiration, surface roughness, and the transfer of heat and water into and out of the soil. They are therefore often treated as effective parameters, since measurements and process relationships derived at individual field sites cannot easily be upscaled to represent the heterogeneous conditions within a model grid box. These parameters are typically prescribed according to plant functional types (PFT), based on the assumption that plants with similar characteristics share comparable physiological properties irrespective of location. For example, evergreen broadleaf trees are assumed to have similar stomatal resistance. In reality, however, vegetation can adapt to local environmental and climatic conditions, meaning that the effective parameter values would vary geographically, even within the same PFT.
Optimising, or tuning, uncertain model parameters is therefore an essential part of developing numerical weather prediction (NWP) and Earth system models (see Raoult et al., 2025). Recently, ECMWF has developed a calibration tool based on a Gaussian process emulator to optimise global parameters, i.e. parameters assumed to be spatially uniform across the model domain (van Niekerk et al., 2025). However, global calibration cannot account for geographical variations in effective parameter values.
To address this spatial variability, the German Meteorological Service (DWD) has introduced a method for online parameter calibration using information from analysis increments, known as Adaptive Parameter Tuning (APT; Zängl, 2023). In this approach, parameters are adapted for each forecast based on empirical relationships between specific parameter values and their related analysis increments of screen-level parameters (see Box A).
Updating parameters at every new analysis cycle (referred to as online tuning) as in the DWD implementation, results in a “model-of-the-day”, in which each forecast run would use a slightly different model configuration. This may introduce challenges for future model developments, as those would consequently be driven more strongly by atmospheric model conditions and screen-level observations, rather than actual physical processes in the land–atmosphere coupling. Moreover, the online approach introduces issues for the retrospective forecasts used to calibrate sub-seasonal and seasonal forecasts. Parameters obtained through online tuning are generally optimised for real-time short-range forecasts and are therefore not directly applicable to forecasts of past events.
A
The APT methodology
The APT methodology as developed by Zängl (2023) is based on the hypothesis that analysis increments – the amount by which a variable is adjusted in the analysis from its current value in a short-range forecast – can be used as predictors of the model biases extending into the short- to medium- ranges. To filter out fast synoptic-scale variability, instantaneous increments computed at each analysis cycle are temporally smoothed using a 2.5 day running mean. This retains the slowly evolving component of the bias signal.
Our current implementation within the IFS uses the 2-metre temperature and humidity analysis increments as the primary predictors. Time-filtered increments are then translated into adjustments of selected model parameters through empirical multiplicative scaling factors. Each predictor is linked to parameters that primarily influence the corresponding screen-level variable. The scaling factors are designed to be multiplicatively antisymmetric. On a logarithmic scale, positive and negative analysis increments of the same magnitude correspond to a reciprocal change in the parameter value, ensuring balanced corrections in either direction.
An alternative approach to online APT
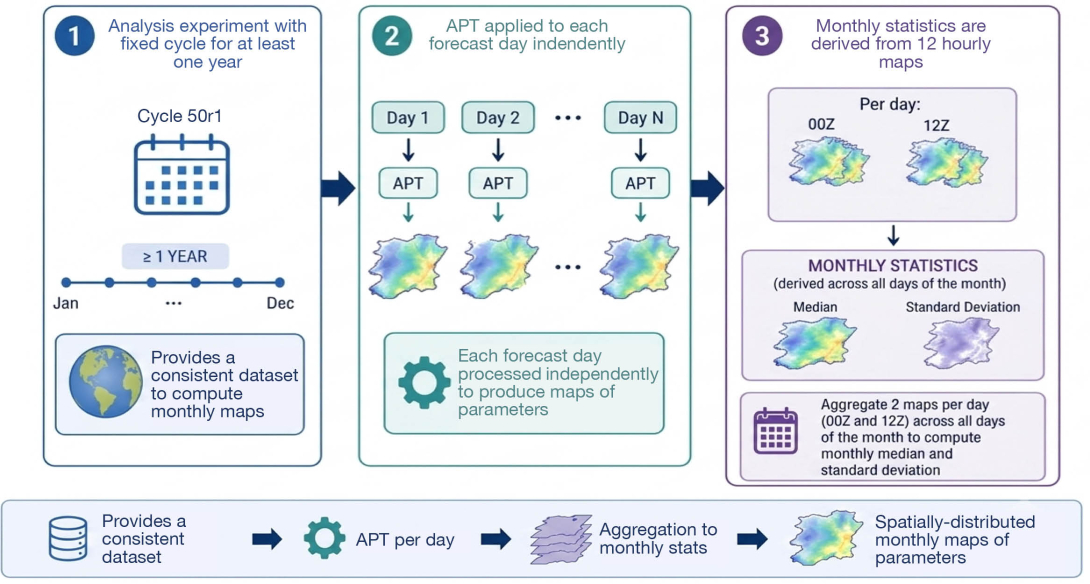
The methodology we have implemented takes a different approach to the operational APT system used by the DWD, while using the same core idea. Rather than applying the online APT to each forecast, the current implementation aggregates APT-derived adjustments into monthly parameter maps. The APT method is applied offline to the analysis increments from a baseline experiment, separately for each 00 and 12 UTC forecast cycle. This produces two maps of tuned parameters per day, which are combined into a daily parameter map. The temporal median of the daily maps is then computed for each month to generate static monthly parameter maps that can then be used as static input fields to the forecast system. A schematic of the workflow is described in Figure 1.
This offline approach offers a more controlled and reproducible alternative to a fully online APT, while still benefiting from the information contained in the analysis increments. It also enables the use of the APT methodology as a diagnostic tool for model development, identifying regions where systematic parameter adjustments may indicate missing or inadequately represented physical processes.
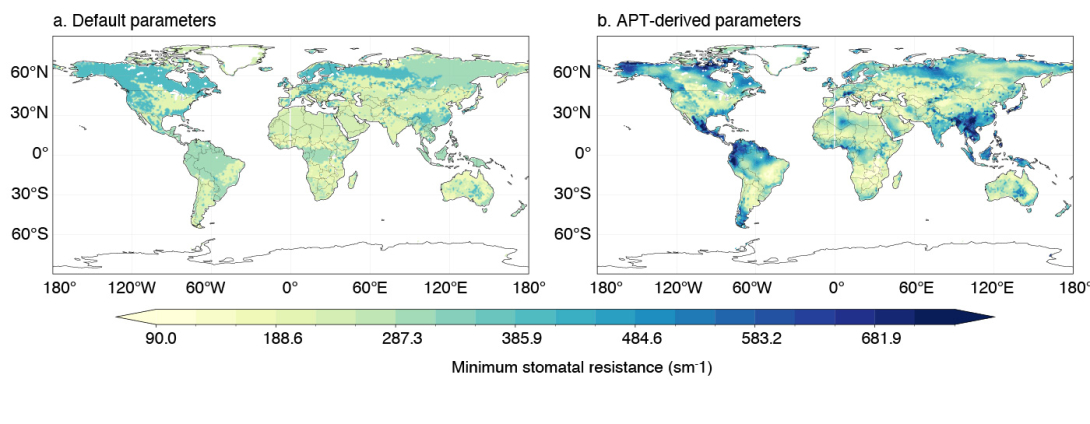
An example of the minimum stomatal resistance for high vegetation (rsmin,h) derived using the offline APT for the month of July is shown in Figure 2. The most striking feature is the substantially greater spatial variability of the APT-derived parameter values compared with the default parameter field. In several regions, including the northern Amazon and Southeast Asia, rsmin,h is increased, indicating that evapotranspiration is likely overestimated in the default model configuration. In contrast, rsmin,h is reduced in other regions, such as eastern Brazil, suggesting that evapotranspiration is underestimated there.
The parameters selected for the first implementation are listed in Table 1. The selection was guided by expert knowledge of the processes controlling key land–atmosphere exchanges, together with the requirement that the parameters influence variables constrained by observations assimilated into the analysis.
| Parameter | Parameter name | Physical process |
|---|---|---|
| rsmin | Minimum stomatal resistance | Evapotranspiration from high and low vegetation |
| Rsoil | Bare soil resistance | Evaporation from soil and deserts |
| lsk | Vegetation skin heat conductivity | Heat conducted into/from the soil underneath |
| lsk,soil | Bare soil skin heat conductivity | Heat conducted into/from the soil underneath |
| lsk,snow | Snow heat conductivity | Heat conducted into/from the snowpack |
| asoil | Albedo of bare soil | Shortwave radiation reflected from the bare soil and deserts |
| asnow | Albedo of snow under forest | Shortwave radiation reflected from canopies with snow underneath |
Impact on forecast skill
We first assessed the impact of the APT-derived maps on forecast skill in deterministic and ensemble forecasts initialised from their own (consistent) analysis. We examined boreal summer (JJA) 2024 and boreal winter (DJF) 2024/2025, comparing these with a control experiment using the default model parameters. The largest impact was found during JJA, so we focus on that period here.
One way to assess the impact is to look at 2-metre temperature analysis increments. In July, the IFS control experiment generally shows substantial positive increments, corresponding to a cold temperature bias, across tropical regions near the Equator; and negative increments, corresponding to a warm temperature bias, over parts of Brazil and southern Africa (Figure 3a). In the experiment with the APT-derived parameter maps, we found a general reduction in the magnitude of the analysis increments, with the largest improvements occurring in the tropical regions where the biases are generally strongest (Figure 3b).
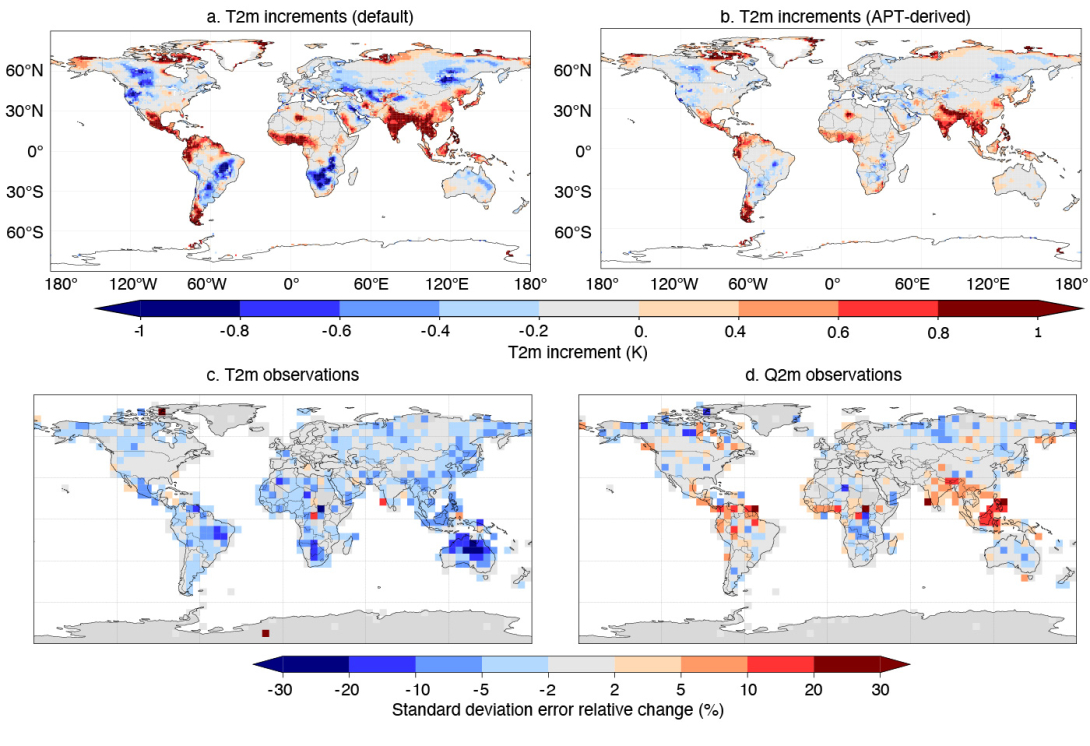
The reduced analysis increments translate into a better agreement between the short-range forecast and 2-metre temperature observations, particularly in the tropics (Figure 3c). The impact of APT is also generally positive across other observing systems. For example, comparison with microwave observations shows a statistically significant improvement in background departures for lower-tropospheric temperature-sensitive channels in the tropics.
A degradation in specific humidity remains under investigation (Figure 3d) and is likely due to missing open-water sources in the land-surface representation, particularly irrigation in India and Southeast Asia. Parameter tuning cannot fully compensate for missing physical processes of the energy and water balances, which may lead to local inconsistencies, in turn helping us identify inconsistencies in the representation of physical processes within the IFS model suite.
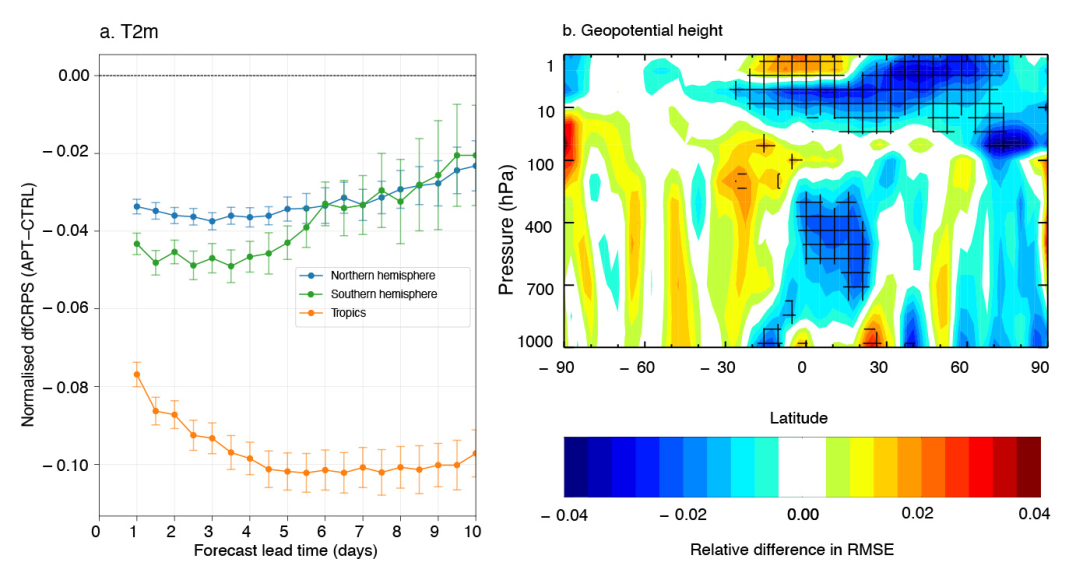
The impact of the updated parameter maps is not limited to short-range forecasts but persists into the medium range. For the global 2-metre temperature evaluated against observations, we found an average improvement of around 10% at day 5 in the tropics, and around 4% in the northern and southern hemispheres (Figure 4a). The impact on 2-metre dew point temperature was broadly neutral after day 1. The large impact in the ensemble configuration is likely driven by the reduction in systematic temperature biases, to which the fair Continuous Ranked Probability Score (fCRPS) is particularly sensitive. The improvements also extended beyond the land surface into the upper troposphere, with an improved forecast of the geopotential height at 500 hPa and even in the stratosphere (Figure 4b). Overall, these results highlight the physical consistency of the updated land parameters and their influence beyond the land surface.
Impact on extreme events
Land–atmosphere interactions are particularly important during heatwaves. Under dry conditions with strong land-atmosphere coupling, evapotranspiration and heat exchange are the main drivers of near-surface temperatures. Therefore, parameter changes that improve these processes can also lead to a better representation of temperature extremes. Given the large local differences between the default and APT-derived maps, we examined their impact during the June 2026 European heatwave, the hottest June on record in western Europe.
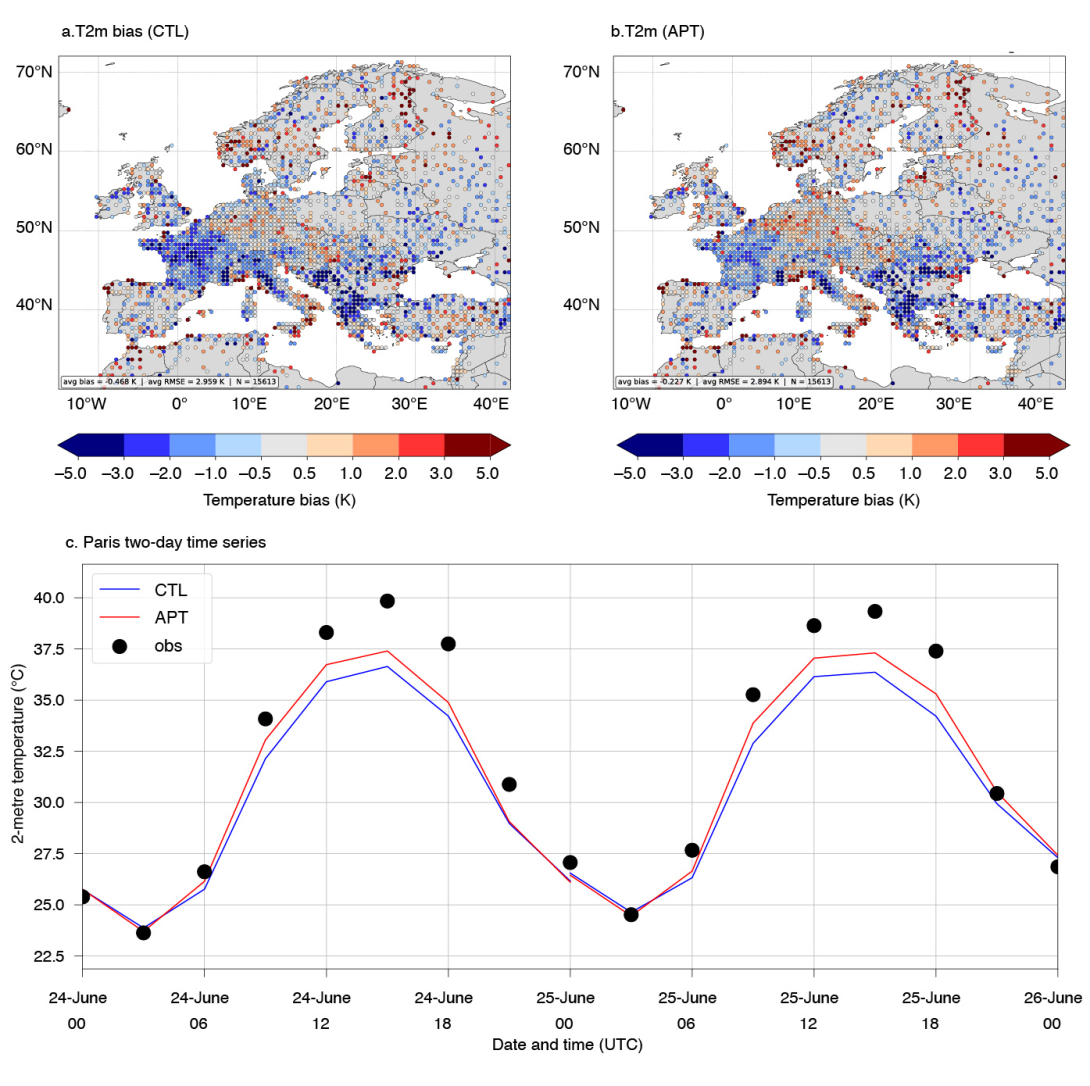
The experiment using the operational model configuration (CTL) shows a widespread cold bias across western Europe, including France, Switzerland and Italy during the June 2026 heatwave (Figure 5a). The largest errors occur over north-western France, where 2-metre temperatures are underestimated by up to 5°C.
A forecast using the APT-derived parameter maps shows a consistent improvement in the representation of the heatwave, with daytime temperatures much closer to observations (Figure 5b). Averaged over Europe, the cold bias is reduced by more than 50%, while the root-mean-square error also decreases. The reduced bias is primarily associated with a more realistic representation of the diurnal cycle of the temperature, as illustrated by the example for a 0.5° × 0.5° box centred on the Paris region (Figure 5c).
The changes to λsk and rsmin together lead to a larger warming of the surface and increased sensible heat flux, through reduced heat conducted in the soil and evapotranspiration.
Conclusions and outlook
Our work shows how using information in the data assimilation analysis increments can be used to optimise land-surface model parameters. By using Adaptive Parameter Tuning (APT) offline, we can derive updated climatological parameter maps that can be applied in subsequent forecasts and across all timescales.
Overall, we found that using the APT-derived maps improved the skill of 2-metre temperature forecasts, with the strongest medium-range benefits in the tropics. The impact was not confined to the surface but extends into the troposphere, illustrating how land processes affect the atmosphere and large-scale circulation.
Beyond improving parameter fields, our method can be used as a diagnostic bridge to model development. Where large or systematic adjustments in the parameters are present, physical processes are likely missing or poorly represented, requiring further attention. As an example, the need for substantial variation in stomatal resistance over certain regions, and the residual humidity bias linked to absent water sources, both flag concrete targets for physical model improvement, irrigation being the clearest current example. Work is now under way to implement the APT-derived maps in the next operational cycle of the IFS.
Further reading
N. Raoult, Douglas, N., MacBean, N., Kolassa, J., Quaife, T., Roberts, A. G. et al., 2025: Parameter estimation in land surface models: Challenges and opportunities with data assimilation and machine learning. Journal of Advances in Modeling Earth Systems, 17, e2024MS004733. https://doi.org/10.1029/2024MS004733
A. van Niekerk, Sutzl, B., Raoult, N., Janošek, M. & Bastak-Duran, I., 2025: Bayesian optimisation of parameters in the ECMWF IFS. ECMWF Technical Memorandum No 934. https://doi.org/10.21957/3febe9bc59
G. Zängl, 2023: Adaptive tuning of uncertain parameters in a numerical weather prediction model based upon data assimilation. Quarterly Journal of the Royal Meteorological Society, 149(756), 2861–2880. https://doi.org/10.1002/qj.4535