NL

Forty years of medium-range forecasting

Philippe Lopez, Mark Rodwell


On 1 August 1979, ECMWF produced its first operational medium-range forecast for Member States. This major achievement marked the first milestone on the road towards producing useful weather forecasts beyond two to three days. It was achieved less than four years after the Convention creating ECMWF was signed on 1 November 1975.

The first forecasts

ECMWF’s first operational medium-range forecasts were produced to ten days ahead, five days a week, but only the first seven days were disseminated to Member States. The model had a horizontal grid spacing of 210 km with 15 vertical levels. Four decades later, improvements in modelling and data assimilation, coupled with vastly greater computing power and observational coverage, have led to much better forecasts as well as a wide range of forecast products and applications.

%3Cstrong%3E%20Original%20forecast,%20re-forecast%20and%20verification.%20%3C/strong%3E%20The%20first%20operational%20ECMWF%20forecast%20was%20a%207-day%20forecast%20from%2012%C2%A0UTC%20on%201%C2%A0August%201979.%20The%20plot%20(left)%20shows%20predicted%201,000%C2%A0hPa%20geopotential%20height%20in%20solid%20contours.%20The%20corresponding%20modern%20re-forecast%20(centre)%20is%20a%2050-member%20ensemble%20forecast.%20The%20verifying%20ERA5%20reanalysis,%20including%20uncertainty,%20is%20shown%20on%20the%20right.%20Initial%20conditions%20for%20the%20re%E2%80%91forecast%20are%20derived%20from%20ERA5.%20The%C2%A0re%E2%80%91forecast%20uses%20the%20current%20operational%20model%20(IFS%20Cycle%2046r1).%20Contours%20show%20the%20ensemble-mean%201,000%C2%A0hPa%20height%20field.%20Grey%20shading%20shows%20the%20ensemble%20standard%20deviation.%20The%20coloured%20regions%20highlight%20different%20details%20and%20ensemble%20information%20available%20in%20present%E2%80%91day%20forecasts.
Original forecast, re-forecast and verification. The first operational ECMWF forecast was a 7-day forecast from 12 UTC on 1 August 1979. The plot (left) shows predicted 1,000 hPa geopotential height in solid contours. The corresponding modern re-forecast (centre) is a 50-member ensemble forecast. The verifying ERA5 reanalysis, including uncertainty, is shown on the right. Initial conditions for the re‑forecast are derived from ERA5. The re‑forecast uses the current operational model (IFS Cycle 46r1). Contours show the ensemble-mean 1,000 hPa height field. Grey shading shows the ensemble standard deviation. The coloured regions highlight different details and ensemble information available in present‑day forecasts.

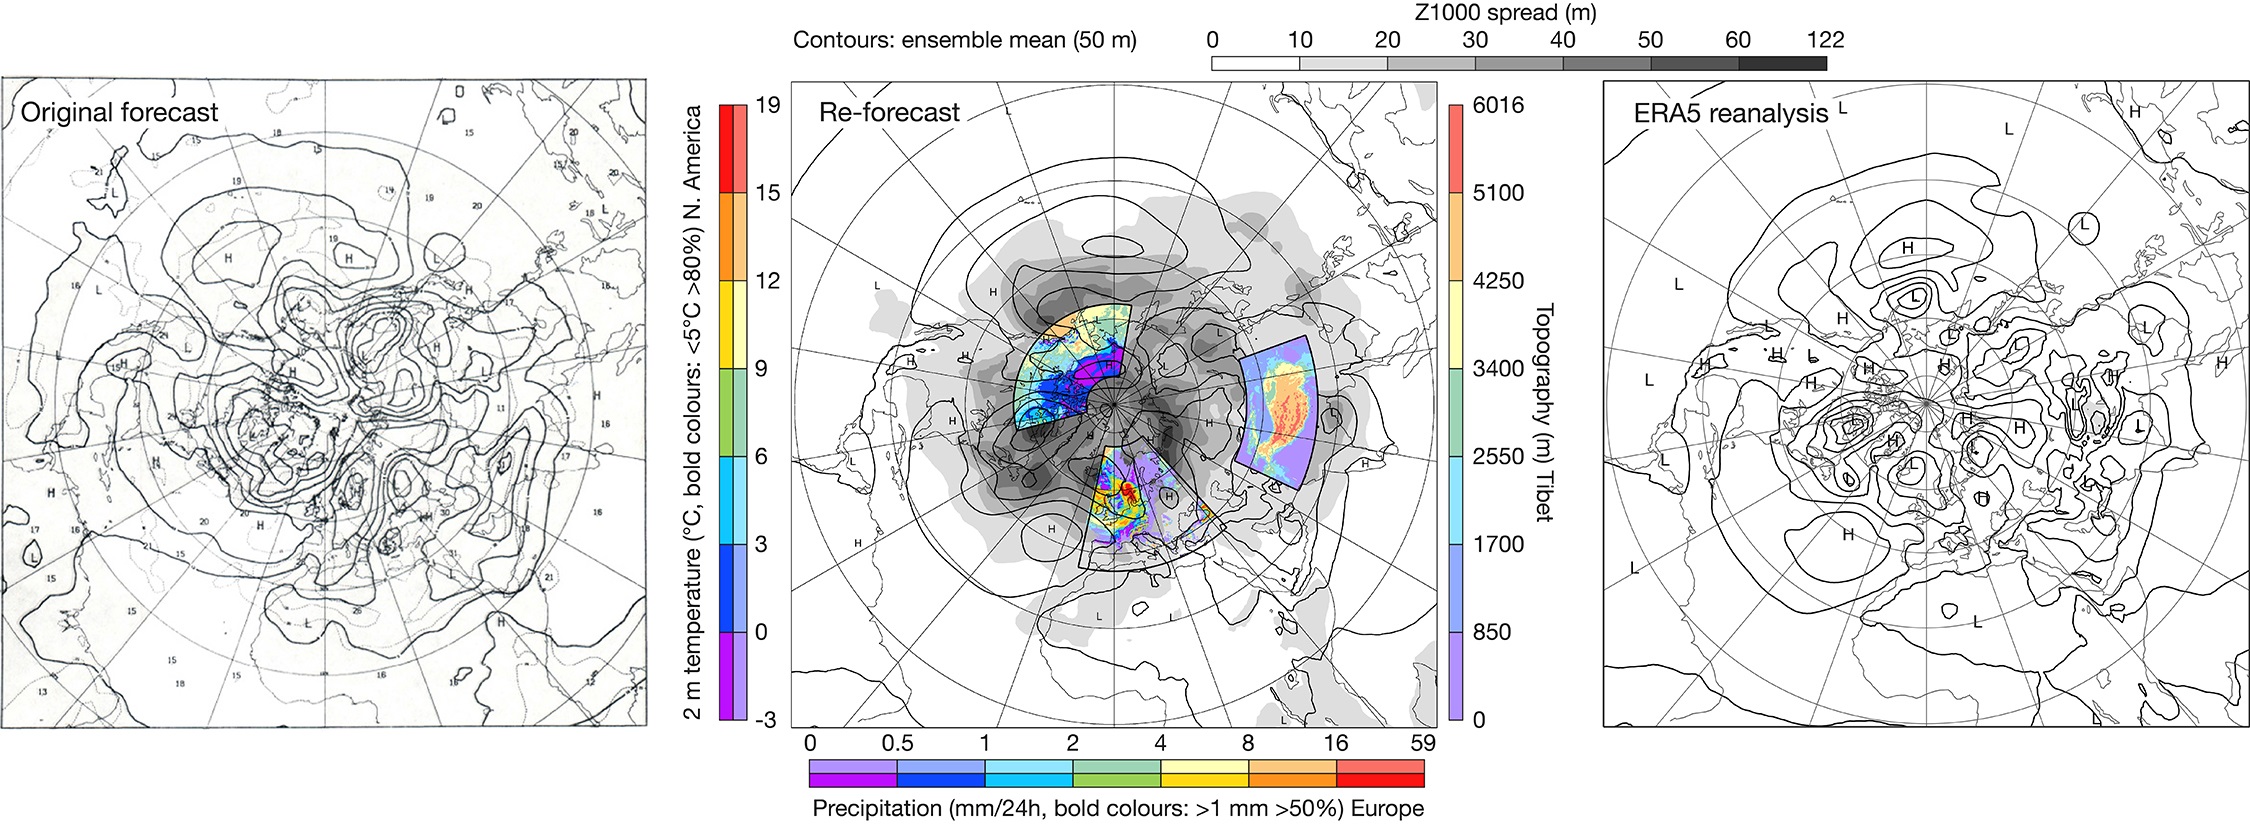
A notable development was the introduction of ensemble forecasts in 1992, following years of research and development. For the first time, these forecasts presented the range of future weather possibilities and their likelihood of occurrence. For example, the grey shading in the 1 August 1979 re‑forecast plot shows the ensemble spread, which indicates substantial uncertainty in some areas. The operational forecast made in 1979 did not come with any quantification of uncertainty. Comparison against the verifying ERA5 reanalysis of 1,000 hPa geopotential on 8 August 1979 illustrates the better performance of the modern re-forecast, with better predicted features such as the Azores anticyclone and the Icelandic Low.

Views from space

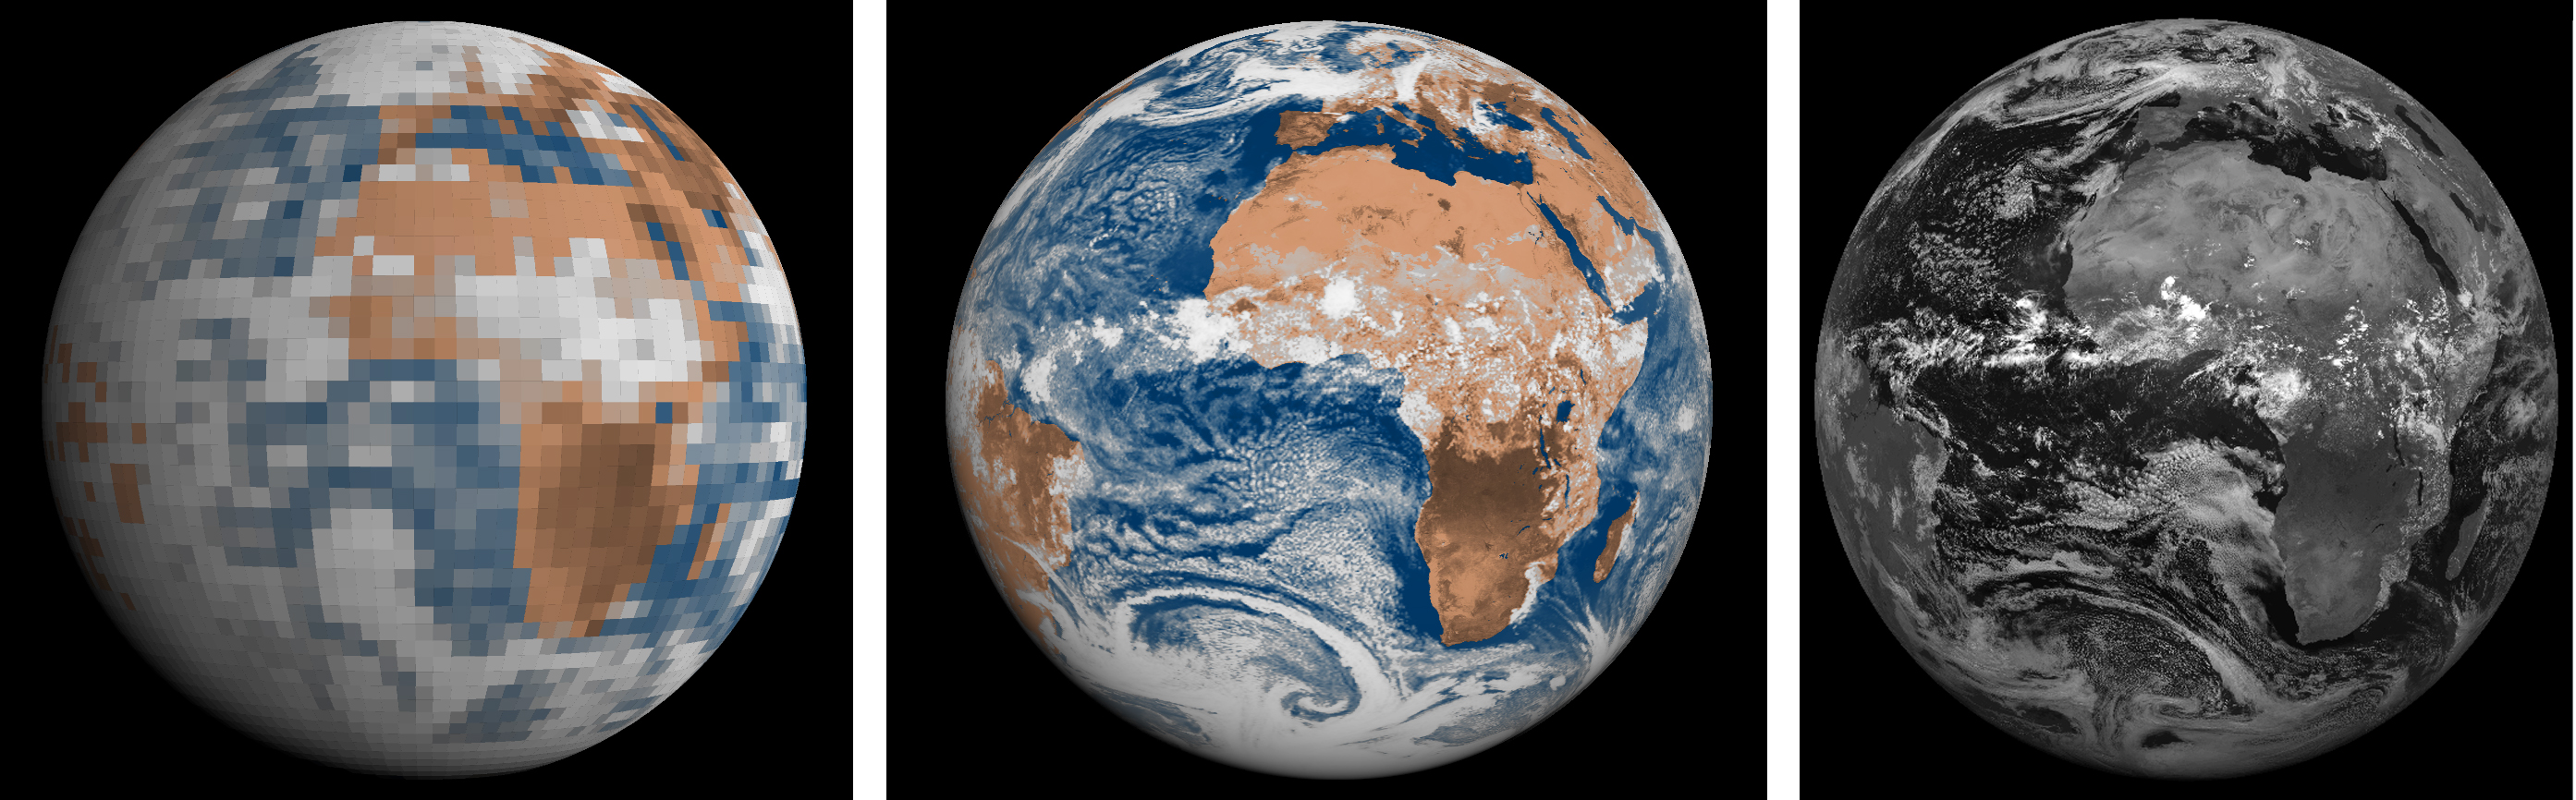
To illustrate the huge progress made over the last few decades in the prediction of cloud systems in the Integrated Forecasting System (IFS), we have created simulated visible images of our planet as seen from a geostationary satellite. The simulated images are based on predicted solar fluxes at the top of the atmosphere from 72‑hour forecasts using the 1985 and 2019 forecasting systems, respectively. The forecasts were initiated on 1 August 1985 at 12 UTC as forecast and satellite data from earlier years are not available in ECMWF’s archive.

%3Cstrong%3E%20Simulated%20satellite%20images%20then%20and%20now.%20%3C/strong%3E%20The%20left-hand%20panel%20shows%20a%20simulated%20satellite%20image%20based%20on%2012%E2%80%91hour-averaged%20solar%20fluxes%20from%20a%2072%E2%80%91hour%20forecast%20from%20the%20original%201985%20operational%20archive%20from%201%C2%A0August%201985%20at%2012%20UTC%20(200%20km%20grid%20spacing);%20the%20middle%20panel%20shows%20a%20corresponding%20re-forecast%20using%20today%E2%80%99s%20IFS,%20initialised%20from%20the%20ERA5%20reanalysis,%20based%20on%201%E2%80%91hour-averaged%20solar%20fluxes%20(9%C2%A0km%20grid%20spacing);%20and%20the%20right-hand%20panels%20shows%20a%20corresponding%20Meteosat%E2%80%912%20satellite%20visible%20image%20(copyright:%20EUMETSAT).
Simulated satellite images then and now. The left-hand panel shows a simulated satellite image based on 12‑hour-averaged solar fluxes from a 72‑hour forecast from the original 1985 operational archive from 1 August 1985 at 12 UTC (200 km grid spacing); the middle panel shows a corresponding re-forecast using today’s IFS, initialised from the ERA5 reanalysis, based on 1‑hour-averaged solar fluxes (9 km grid spacing); and the right-hand panels shows a corresponding Meteosat‑2 satellite visible image (copyright: EUMETSAT).

For more details, read our web article published on 31 July 2019: https://www.ecmwf.int/en/about/media-centre/news/2019/ecmwf-celebrates-40‑years‑operational-medium‑range-forecasting.