On 16 May 2018, ECMWF implemented a major upgrade of the European Flood Awareness System (EFAS), which produces flood forecasts for 57 countries. The new model cycle, informally named ‘Extended Domain’ and officially EFAS version ER15, has been co-developed by ECMWF, which is the EFAS computational centre, and the European Commission’s Joint Research Centre (JRC), which manages EFAS.
The upgrade has increased the geographic coverage of EFAS and has improved the observation processing and hydrological modelling. Technical changes include a revision of file formats and the geographic projection to make the products more user-friendly. The model computer code has been modernised, new meteorological and static input maps were created, the hydrological model was recalibrated, and a new climatology and reforecasts were generated.
A full evaluation of forecast performance for EFAS vER15 is in progress, and summary results will be provided to EFAS partners when the evaluation is complete. Initial findings show improvements in hydrological model performance against observations when the new model calibration is used. This is expected to improve forecast performance as it means that the recalibrated model is better at representing the physical behaviour of catchment areas.
What is EFAS?
EFAS is an operational pan-European flood forecasting system funded by the European Commission through its Copernicus Programme. The aim of EFAS is to support preparatory measures before major flood events strike, particularly in large transnational river basins and throughout Europe in general.
Following the major floods that hit parts of central Europe in 2002, EFAS was developed and tested at the Joint Research Centre (JRC) between 2003 and 2012, in close collaboration with national hydro-meteorological services across Europe, the European Commission’s Emergency Response and Coordination Centre (ERCC), and other research institutes. In 2012, EFAS became the Early Warning System for flood hazards of the Copernicus Emergency Management Service (CEMS), and ECMWF became the computational centre for CEMS-floods (EFAS-COMP). The Centre also took over responsibility for the web interface and archiving.
EFAS provides coherent medium-range flood forecasts and related information, including short-range flash flood products, flood impact assessment and hydrological seasonal outlooks. It keeps the ERCC informed about ongoing floods and about the possibility of upcoming floods across Europe. Today, EFAS delivers forecasts to more than 70 hydro-meteorological and civil protection services in Europe.
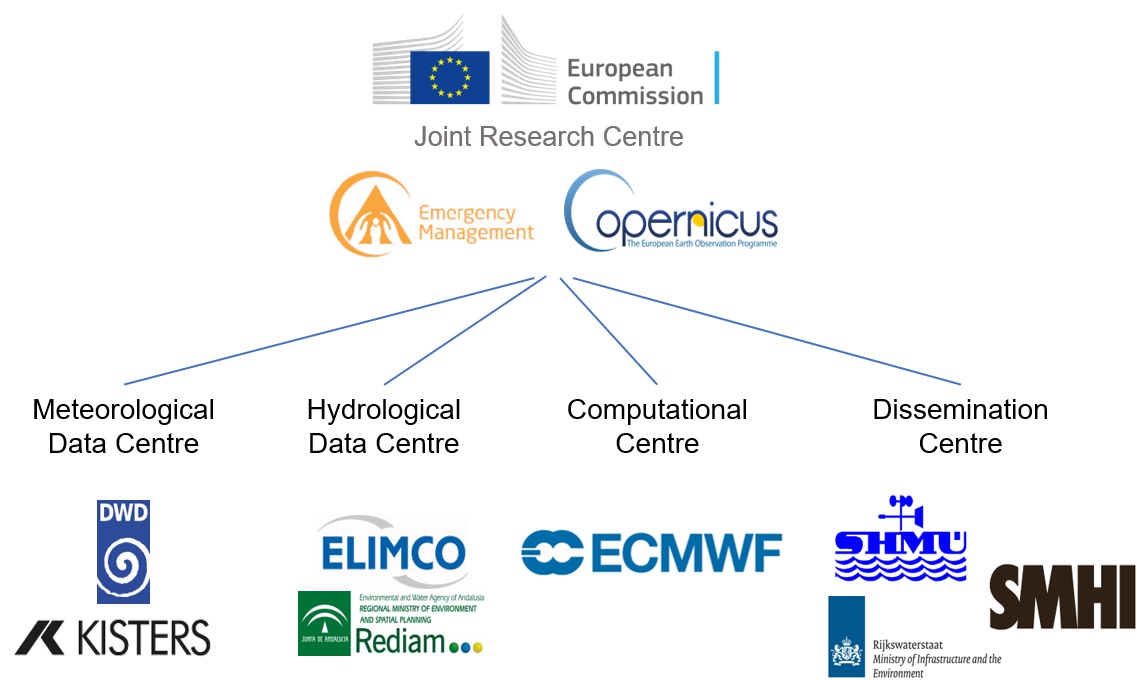
EFAS is managed by the JRC, and it comprises four centres run by different consortia (Figure 1):
- Computational centre (EFAS-COMP): the European Centre for Medium-Range Weather Forecasts produces forecasts and hosts the EFAS-Information System platform
- Dissemination centre (EFAS-DISS): the Swedish Meteorological and Hydrological Institute, the Dutch Rijkswaterstaat, and the Slovak Hydro-Meteorological Institute analyse EFAS on a daily basis and disseminate information to EFAS partners and the ERCC
- Hydrological data collection centre (EFAS-HYDRO): the Environmental and Water Agency of Andalucía (REDIAM) and Soologic Technological Solutions SL collect historical and real-time river discharge and water level data across Europe
- Meteorological data collection centre (EFAS-METEO): KISTERS AG and the German national meteorological service (Deutscher Wetterdienst, DWD) collect historical and real-time meteorological data across Europe
How does EFAS work?
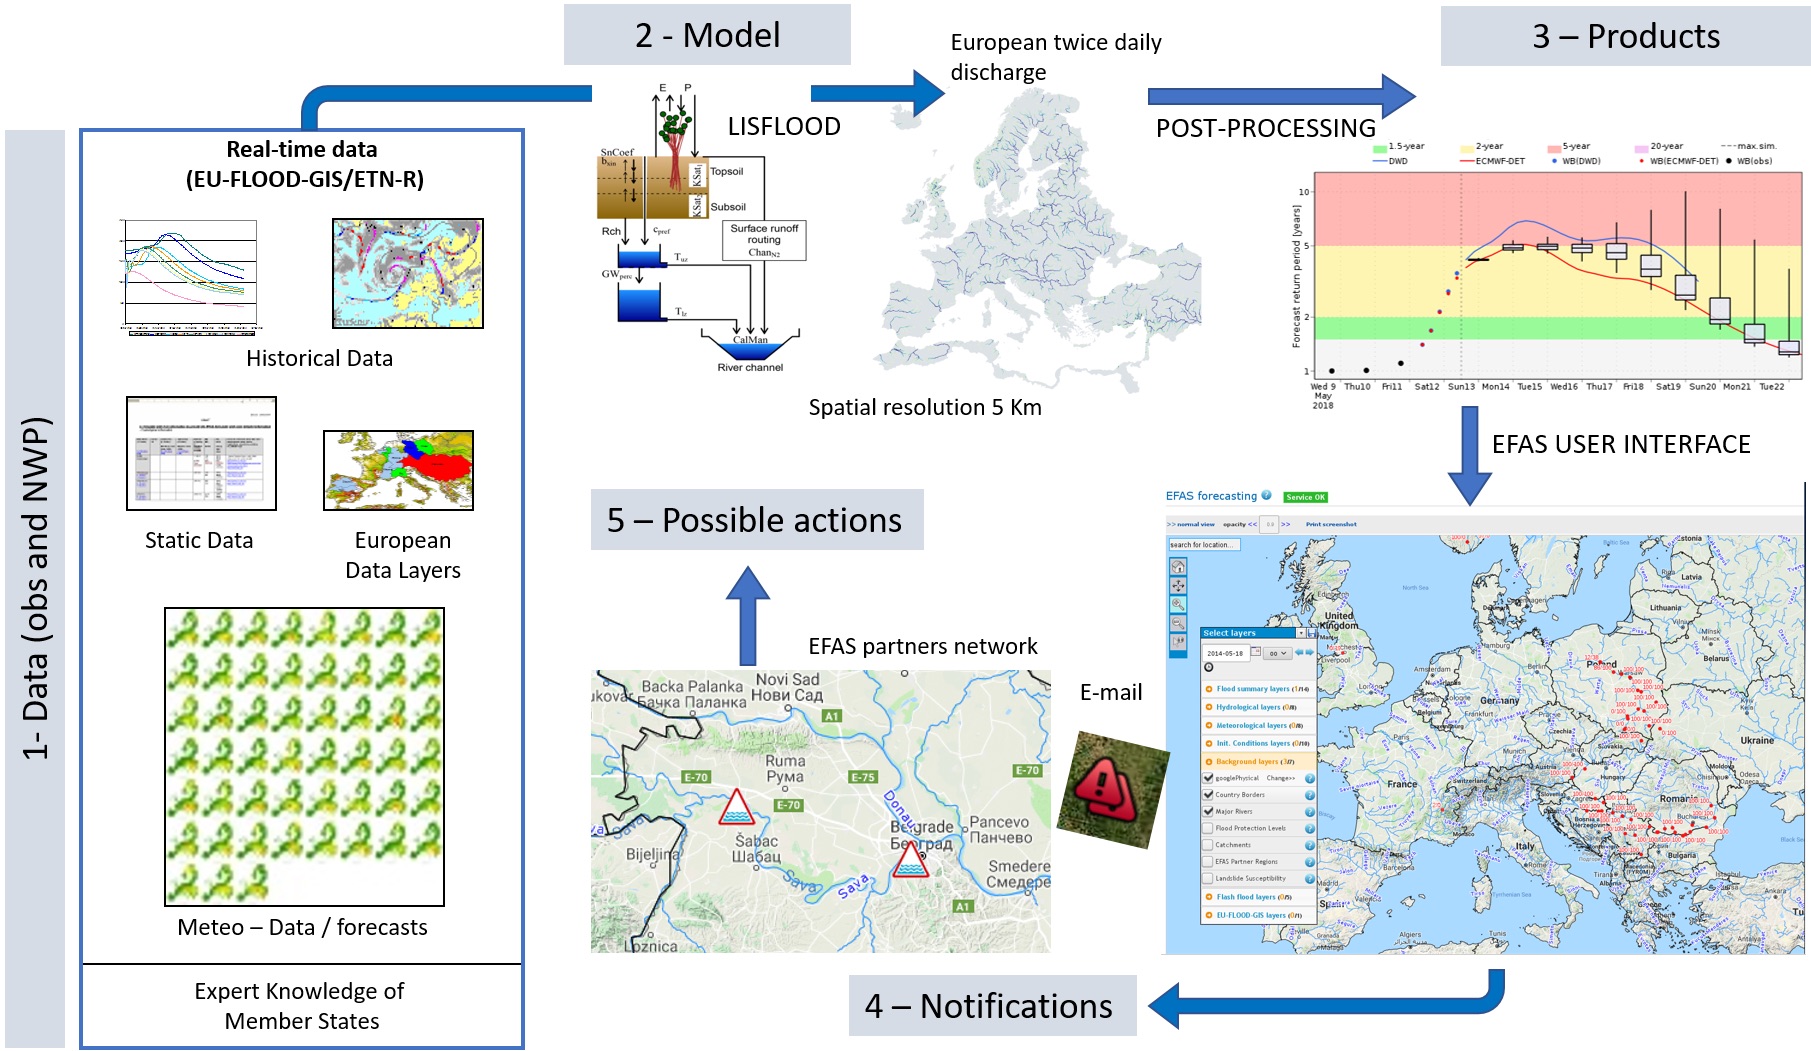
EFAS forecasts are generated by cascading an ensemble of meteorological forecasts (from ECMWF, DWD and the COSMO Limited-Area Ensemble Prediction System consortium), meteorological and hydrological observations, land surface information and model parameters (static maps) through a deterministic hydrological model (LISFLOOD) and algorithms for flash floods. The resulting flood forecasts are then post-processed to produce all EFAS products, including flood alerts of different severity levels. Three alert levels are highlighted, corresponding to forecasts of floods expected to exceed flood peaks with return periods of 2, 5, and 20 years (a return period indicates the average number of years expected to pass between two floods of the predicted magnitude or greater). After the flood forecasts are produced at ECMWF, EFAS-DISS duty officers evaluate the forecasts and issue email notifications to EFAS partners. The schematic overview in Figure 2 summarises the EFAS production and dissemination chain.
For more information on EFAS, see: www.efas.eu/user-information.html
EFAS vER15: a major upgrade
Like other operational forecasting systems, EFAS is always evolving, but the May 2018 upgrade combined a large number of changes in a single development cycle. The sections that follow provide an overview of what has changed. Further details on the upgrade can be found in Salamon et al. (2018).
EFAS expands to the east and the south
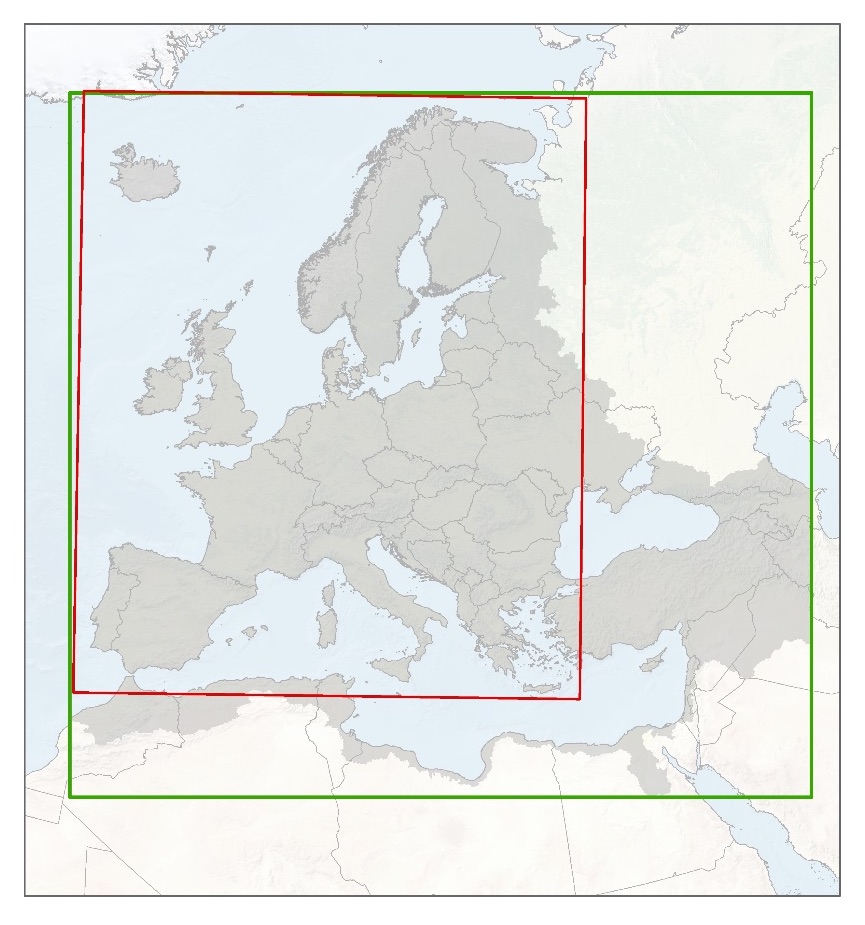
To reflect the growing number of EFAS partners, in version ER15 geographic coverage has been increased by more than two million km2 to the east and the south. It now includes about 5,300 new river basins located near the eastern and southern borders of the EU and 14 new countries (Turkey, Cyprus, Georgia, Azerbaijan, Armenia, Israel, Lebanon and parts of Syria, Iraq, Egypt, Libya, Tunisia, Algeria and Morocco) (Figure 3).
The change in the geographic domain was accompanied by a change in the geographical projection. EFAS now uses the INSPIRE-compliant ETRS89 Lambert Azimuthal Equal Area Coordinate Reference System (ETRS-LAEA). ETRS-LAEA is the recommended projection for pan-European statistical mapping at all scales or where true area representation is required.
New meteorological observation processing
Meteorological inputs are crucial to EFAS to run long-term simulations and to estimate the hydrological initial conditions of the system’s forecasts. EFAS-METEO collects datasets of historical and real-time in-situ meteorological observations on a 24/7 basis and interpolates them to the 5 km hydrological model grid. The data is then sent to ECMWF each day for inclusion in the EFAS modelling chain. The number of contributors and observations (both in near-real time and historical records) provided to EFAS keeps growing. Today about 5,600 rain gauges and 8,900 temperature stations routinely provide data in real time for EFAS vER15. As part of the upgrade, a new interpolation scheme was introduced, called SPHEREMAP. The scheme gives different weights to observations depending on the number of nearby stations and their distance from the interpolated point and from each other, to avoid giving too much weight to stations in close proximity to each other. All meteorological observation forcing maps are EFAS products. They are included as summary maps in the EFAS web interface, which is currently only accessible to EFAS partners.
Quality-assured hydrological data
Near-real-time river discharge observations are used to adjust (post-process) EFAS forecasts. The EFAS hydrological data collection centre oversees collecting, validating and filling gaps in discharge and water level data for both near-real-time and historical records. As part of the recent upgrade, EFAS-HYDRO increased the number of data providers and it now collects data for about 1,700 near-real-time stations and about 2,900 historical stations from 60 different data providers.
Hydrological model upgrade
Most EFAS flood forecast products are based on outputs from LISFLOOD, a rainfall-runoff and routing model. LISFLOOD has been developed at the JRC since the year 2000 and has been used for operational flood forecasting at the pan-European scale since the early days of EFAS. Driven by meteorological forcing data (precipitation, temperature, potential evapotranspiration, and evaporation rates for open water and bare soil surfaces), LISFLOOD calculates a complete water balance at a 6-hourly or daily time step for every 5 km grid cell within the EFAS domain. Processes simulated for each grid cell include snowmelt, soil freezing, surface runoff, infiltration into the soil, preferential flow, redistribution of soil moisture within the soil profile, drainage of water to the groundwater system, groundwater storage, and groundwater base flow. Runoff produced for every grid cell is then routed through the river network using a kinematic wave approach. The model also includes options to simulate lakes and reservoirs (Figure 4).

In EFAS vER15, a new parametrization of water infiltration into the soil using three soil layers instead of two was introduced. Evaporation from open water was also included, to improve the realism of modelled losses from reservoirs and lakes. A water abstraction component was added, making it possible to define the amount of water resources removed for the purposes of agriculture including livestock farming, the manufacturing industry, energy production (cooling water needs), and public-sector water use. Finally, crop irrigation and paddy-rice irrigation components were added to dynamically simulate the water needs associated with the cultivation of land.
The upgrade also includes an improved representation of the storage and release of water by different land surface components. The new scheme better reflects how much water is already present and how much is added/removed by the atmosphere and vegetation. This part of the water cycle has an impact on future river discharge.
Change in LISFLOOD code
Since the first operational implementation of EFAS in 2012, the LISFLOOD code has been completely rewritten by the JRC. Earlier LISFLOOD versions were coded using PCRaster, a software package for environmental dynamic modelling including convenient hydrological and hydraulic routing functions. The LISFLOOD version implemented in EFAS vER15 was recoded using the Python programming language and PCRaster Python extension, which enables the use of the PCRaster modelling engine from Python. The structure of the code was made more modular and flexible. The NetCDF file format was adopted for inputs and outputs, to replace the previous PCRaster format. The internal file structure and naming convention was also changed to comply with World Meteorological Organization conventions.
Upgrade in static input maps
The EFAS pan-European setup of LISFLOOD uses a 5 km grid and spatially variable input parameters, also called static maps. Sub-grid information on land use (100 m resolution), soil type (1 km resolution) and elevation (100 m resolution) is incorporated into the model using land use fractions. EFAS vER15 uses a revised range of land use types, including forest, built-up area, water surface, irrigated land and paddy rice land. Leaf Area Index maps are used to help simulate evapotranspiration. Elevation bands within each 5 km grid based on 100 m digital elevation model maps are used to model snow accumulation and snowmelt. Soil information at 1 km is used to determine hydraulic soil parameters, aggregated to 5 km. River channel network and related parameters as well as water demand, water abstraction and water consumption maps are used for all water-balance and river routing processes. All maps were upgraded by the JRC to match the new projection, spatial coverage and process representation of EFAS vER15, with final checks and integration into the production chain performed by ECMWF.
Finally, the number of reservoirs accounted for in EFAS vER15 is 1,454, up from 34 in the previous version. Location and total reservoir volume are the primary metrics available from external sources. Other reservoir parameters were estimated or included in model calibration.
Recalibration of the hydrological model
Like most rainfall-runoff models, LISFLOOD hydrological model equations include a range of parameters. Some of these can be determined from physical data, such as reservoir storage-elevation curves or the drainage area of watersheds. Others vary from one area to another based on changes in climatology and physical factors, e.g. hydraulic soil properties. Some model parameters require calibration, which is generally obtained by tuning parameter values based on a comparison between simulated and observed daily discharge (Q) at catchment outlets. This tuning or optimisation process generally aims to minimise errors in the volume and timing of simulated flow over a multi-year period.
With new processes introduced and increased geographic coverage, LISFLOOD was recalibrated by the JRC, which produced pan-European parameter maps based on calibration over 717 catchments. The optimisation procedure was carried out using Kling-Gupta Efficiency criteria (KGE). KGE is a goodness-of-fit measure varying between 1.0 (perfect simulation) and negative infinity (lower limit), developed to diagnose differences in correlation, bias and variability between observations and simulations. The 13 model parameters optimised by calibration were first estimated by prior expert knowledge. They relate to snowmelt, infiltration, preferential bypass flow through the soil matrix, percolation to the lower ground water zone, percolation to deeper groundwater zones, residence times in the soil and subsurface reservoirs, river routing and reservoir/lake simulation. The 717 calibration points were selected according to spatial and data availability criteria. To evaluate the temporal transferability of the calibrated parameter set, observed meteorological and river discharge records were split into a ‘calibration’ and an ‘evaluation’ period.
Following calibration, 75% of stations scored a KGE higher than 0.5 for the calibration period and 57% scored more than 0.5 for the evaluation period. The skill varies across geographical domains, with higher skill scores in large parts of central Europe and lower skill scores mostly in catchments where the influence of reservoirs is stronger, such as in Spain (Figure 5). Note, however, that low hydrological simulation skill associated with calibration/evaluation periods is not necessarily an indicator of poor forecast performance as EFAS forecasts are compared with model-derived thresholds.

New flood magnitude thresholds
After all model implementation and calibration tasks were completed, LISFLOOD reference simulations were generated for the period 1990 to 2016 using observed meteorological data as input. This reference simulation, also called ‘simulation from observations’, was used to estimate new discharge thresholds associated with floods with return periods of 1, 2, 5 and 20 years, and threshold anomalies for the seasonal outlooks. Those new thresholds now form the basis for flood notifications.
In addition, the European Runoff Index based on Climatology (ERIC) algorithm, which is used to derive flash flood products from COSMO-LEPS rainfall forecasts and near-real-time LISFLOOD soil moisture simulations (Figure 6), was also upgraded to account for the new three-layer soil scheme in LISFLOOD.

Hydrological forecast post-processing
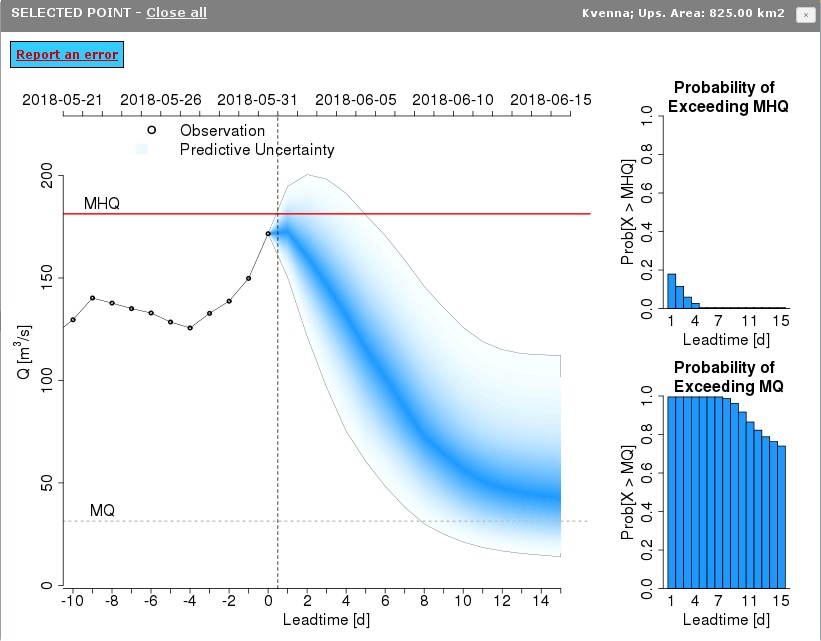
Where near-real-time river discharge observations are available, LISFLOOD flood forecasts can be adjusted via statistical post-processing to minimise errors in the timing, the volume and the height of the peak when compared to observations, but also to derive more accurate probabilistic forecasts (Figure 7). The EFAS vER15 system now includes about 600 adjusted (post-processed) forecast points, covering all major European rivers. This has been made possible thanks to the strong partnership between hydro-meteorological agencies across Europe and the EFAS consortium, as a result of which access to automatic river gauge measurements was granted through EFAS-HYDRO.
Seasonal forecast upgrade
As part of the upgrade, the EFAS seasonal forecast production chain was modified to now use ECMWF’s most recent seasonal forecasting system (SEAS5). SEAS5 benefits from a much higher atmospheric horizontal resolution than its predecessor S4 (36 km instead of 80 km). It also includes a better ocean model and a 25-member re-forecast ensemble (up from 15 members in S4). The EFAS seasonal release date has also been brought forward, from the 7th to the 5th day of each month.
Flood hazard and impact assessment
The EFAS system uses a rapid risk assessment procedure to estimate flood extent as well as potential flood impacts based on EFAS forecasts. Every time a flood event is forecast in EFAS, the procedure identifies river sections where the magnitude of predicted peak discharge is expected to exceed the local flood protection level. For these river sections, the procedure identifies flood-prone areas using a catalogue of flood hazard maps covering the entire EFAS river network. These event-based flood hazard maps are combined with exposure information to assess several categories of impact, such as affected population, roads and cities, the total extent of urban and agricultural areas affected, and direct economic losses.
The EFAS vER15 upgrade has integrated the FLOPROS global dataset and information on design protection levels, where available, into the EFAS database of flood protection levels, and the global set of flood damage functions provided by Huizinga et al. (2017) into the vulnerability functions.
Evaluation
Although a full evaluation of forecast performance for EFAS vER15 is still in progress, some results comparing the new calibration with the previous calibration are already available. In six catchment areas, hydrological simulations using the previous calibration and the new calibration were compared against discharge observations to determine differences in bias and KGE scores. The results, summarised in Table 1, show a general improvement in scores when using the new calibration. This is expected to lead to better forecast performance as it means that the recalibrated hydrological model is better able to represent the physical behaviour of the catchments.
|
Catchment |
Station |
Area (103 km2) |
Change in bias (%) |
Change in KGE (%) |
|---|---|---|---|---|
|
Danube |
Bazias |
569 |
2.0 |
5.0 |
|
Rhine |
Duesseldorf |
147 |
2.9 |
0.0 |
|
Oder |
Hohensaaten |
112 |
-1.6 |
4.2 |
|
Po |
Pontelagoscuro |
71 |
13.4 |
26.1 |
|
Elbe |
Dresden |
52 |
0.5 |
2.4 |
|
Ebro |
Zaragoza |
41 |
5.4 |
2.5 |
Table 1 Differences between the new and the previous calibration for six catchment areas. Positive values mean a smaller bias and better KGE score when using the new calibration. The bias values were calculated in per cent by comparing simulations with observations.
EFAS verification helps to assess the performance of ECMWF’s forecasts, for example precipitation forecasts. It also helps to evaluate the realism and performance of land surface modelling, in particular for land surface variables such as runoff and soil moisture. As part of the verification of EFAS forecasting performance, the EFAS team works closely with other teams at ECMWF to develop appropriate verification software.
Further reading
Burek, P., J. van der Knijff & A. de Roo, 2013: LISFLOOD Distributed Water Balance and Flood Simulation Model. Revised User Manual. JRC Technical Report No. JRC78917.
Huizinga, J., H. de Moel & W. Szewczyk, 2017: Global Flood depth-damage functions. JRC Technical Report No. JRC105688.
Salamon, P., L. Arnal, S. Asp, C. Baugh, H. Beck, B. Bisselink, A. De Roo, J. Disperati, F. Dottori, M. Garcia-Padilla, R. Garcia‐Sanchez, E. Gelati, G. Gomes, M. Kalas, B. Krzeminski, M. Latini, V. Lorini, C. Mazzetti, M. Mikulickova, D. Muraro, C. Prudhomme, A. Rauthe-Schöch, K. Rehfeldt, C. Schweim, J. Skoien, P. Smith, E. Sprokkereef, V. Thiemig, F. Wetterhall & M. Ziese, 2018: EFAS upgrade for the extended model domain, EUR 29323 EN, Publications Office of the European Union, Luxembourg, doi:10.2760/806324.
Smith, P., F. Pappenberger, F. Wetterhall, J. Thielen, B. Krzeminski, P. Salamon, D. Muraro, M. Kalas & C. Baugh, 2016: On the operational implementation of the European Flood Awareness System (EFAS). ECMWF Technical Memorandum No. 778.