Datasets
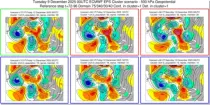
These charts show clustering of ENS members based on the 500 hPa height forecasts. ...
Interval/period: N/A
Interval/period: Sun, 01/01/1860 - Mon, 12/31/2300
Interval/period: Wed, 01/01/1800 - Fri, 12/31/2100
Interval/period: Sun, 01/01/1860 - Mon, 12/31/2300
Interval/period: Sun, 01/01/1860 - Mon, 12/31/2300
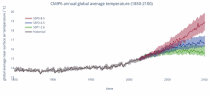
CMIP6 data underpins the Intergovernmental Panel on Climate Change 6th Assessment Report. The use of these data is mostly aimed at:
addressing outstanding scientific questions that arose as part of the IPCC reporting process;
improving the understanding of the climate system;
Interval/period: Sun, 01/01/1860 - Mon, 12/31/2300

Interval/period: N/A
Interval/period: N/A
Interval/period: N/A
Interval/period: N/A

4-month long 101-ensemble member seasonal attribution experiment (I20_BC98) initialised on 01-November-1997 using the atmosphere-only version of SEAS5 (see Johnson et al., 2019) forced with daily ERA5 SST as in the reference experiment (R98) but with daily SST over the tropical Indian Ocean swapped with that from 2019/20.
Examples
Interval/period: N/A
4-month long 101-ensemble member seasonal attribution experiment (I20_BC16) initialised on 01-November-2015 using the atmosphere-only version of SEAS5 (see Johnson et al., 2019) forced with daily ERA5 SST as in the reference experiment (R16) but with daily SST over the tropical Indian Ocean swapped with that from 2019/20.
Examples
Interval/period: N/A
4-month long 101-ensemble member seasonal attribution experiment (I98_BC20) initialised on 01-November-2019 using the atmosphere-only version of SEAS5 (see Johnson et al., 2019) forced with daily ERA5 SST as in the reference experiment (R20) but with daily SST over the tropical Indian Ocean swapped with that from 2019/20.
Examples
Interval/period: N/A
4-month long 101-ensemble member seasonal attribution experiment (I16_BC20) initialised on 01-November-2019 using the atmosphere-only version of SEAS5 (see Johnson et al., 2019) forced with daily ERA5 SST as in the reference experiment (R20) but with daily SST over the tropical Indian Ocean swapped with that from 2019/20.
Examples
Interval/period: N/A
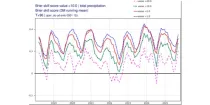
These diagrams show Brier Skill Scores (BSS) for two parameters at several forecast lead-times ...
Interval/period: N/A
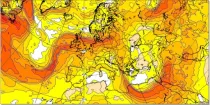
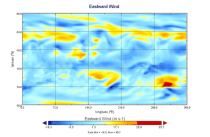
Bulk Wind Shear charts show the scalar value of the shear between the winds at the two pressure levels selected. Shear can be useful in assessing the strength of a front or...
Interval/period: N/A
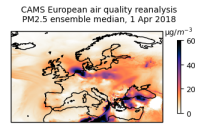
This dataset provides daily air quality analyses and forecasts for Europe.
Interval/period: N/A
Interval/period: Tue, 01/01/2013 - Tue, 12/31/2024

This dataset provides annual air quality reanalyses for Europe based on both unvalidated (interim) and validated observations.
Interval/period: N/A
CAMS atmospheric composition forecast experiment set up to explore data information content in the scope of a ESoWC project. The data is encoded as IEEE single-precision (32-bit floats) circumventing any other lossy compression. This is in contrast to the default 24-bit linear packing used for CAMS in the ECMWF data archive and on the Copernicus Atmosphere Data Store. Explanation of parameter ids can be found at: https://apps.ecmwf.int/codes/grib/param-db/
Examples
Interval/period: N/A
Interval/period: N/A
Interval/period: N/A
Interval/period: N/A
Interval/period: N/A
Interval/period: N/A