Datasets
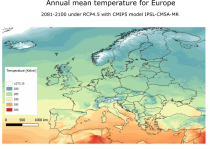
Interval/period: Sun, 01/01/1950 - Thu, 12/31/2099
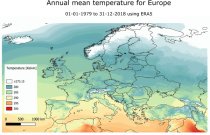
Interval/period: Mon, 01/01/1979 - Mon, 12/31/2018

noDropsonde experiment (other all usual observation types assimilated) for Observing System Experiment (OSE) looking at ARs affecting western USA DeHaan et al (2023). Experiment from 2019-01-28 to 2019-04-30, control is h4qi.
Examples
retrieve, class=rd, stream=lwda, expver=h4ss, type=fc, levtype=pl, levellist=250, param=131, date=2019-01-30, time=00:00:00, step=0/12/24/48, target='output.grib'Forecast fields for u-wind @250 hPa, step gives forecast range in hours
Interval/period: N/A
noDropsonde experiment (other all usual observation types assimilated) for Observing System Experiment (OSE) looking at ARs affecting western USA DeHaan et al (2023, WAF, submitted). Experiment from 2020-01-20 to 2020-04-28, control is hd8r.
Examples
retrieve, anoffset=9, class=rd, date=2020-01-20, expver=hd8r, levtype=sfc, step=0/12/24/48, param=137.128, stream=lwda, time=00:00:00, type=fc, target="output.grib"Forecast fields of integrated water vapour, step gives forecast range in hours
Interval/period: N/A
Interval/period: Sun, 01/01/1950 - Sun, 07/05/2026
ECLand offline surface model (CY49R1) run forced by ERA5 reanalysis with CAMAFLOOD activated. For use in ML land emulation experiments.
Examples
retrieve, class=rd, date=2010-01-01, expver=i6aj, levtype=sfc, param=swvl1, stream=oper, time=00:00:00, type=an, target="swvl1_2010_01_01_00.grib"Extracting a single soil moisture field, type=an
Interval/period: N/A
ECLand offline surface model (CY49R1) run forced by ERA5 reanalysis with CAMAFLOOD activated. For use in ML land emulation experiments.
Examples
retrieve, class=rd, date=2010-01-01, expver=i8ki, levtype=sfc, param=swvl1, stream=oper, time=00:00:00, type=an, target="swvl1_2010_01_01_00.grib"Extracting a single soil moisture field, type=an
Interval/period: N/A
ecLand offline surface model (CY49R2) run forced by ERA5 reanalysis. For use in ML land emulation experiments.
Examples
retrieve, class=rd, stream=oper, expver=isc8, type=an, levtype=sfc, param=swvl1, date=2000-01-01, time=00:00:00, step=24, target='swvl1_2000_01_01_00.grib'Extracting a single soil moisture field, type=an
Interval/period: N/A
ecLand offline surface model (CY49R2) run forced by ERA5 reanalysis. For use in ML land emulation experiments.
Examples
retrieve, class=rd, stream=oper, expver=iscb, type=an, levtype=sfc, param=swvl1, date=2000-01-01, time=00:00:00, step=24, target='swvl1_2000_01_01_00.grib'Extracting a single soil moisture field, type=an
Interval/period: N/A
This dataset contains parameters from 24-month extended-seasonal reforecasts using the ECMWF seasonal forecast system 5 (SEAS5, Johnson et al, 2019). The reforecasts are intialised on 01-May and 01-November with 25 ensemble members and cover the period 1981-2024. Note that these forecasts are not real-time operational products; rather, they are experimental and generated as part of the ASPECT project (https://www.aspect-project.eu).
Interval/period: N/A
The dataset contains the ECMWF Clear Air turbulence (CAT) parameter (units of EDR) on model levels for the SOUTHTRACK flight days. For the different flight days the CAT parameter is produced hourly (step 1 to 24)
Examples
Interval/period: N/A
This dataset contains parameters from four-month long seasonal reforecasts using ECMWF IFS cycle CY49R1 v-version 4 covering the period 1993-2019 and forced with datasets for Leaf Area Index (LAI) and Land Use/Land Cover (LULC) developed in the CONFESS project (https://confess-h2020.eu).
Interval/period: N/A
This dataset contains parameters from four-month long seasonal reforecasts using ECMWF IFS cycle CY49R1 v-version 4 covering the period 1993-2019 and forced with datasets for Leaf Area Index (LAI) and Land Use/Land Cover (LULC) developed in the CONFESS project (https://confess-h2020.eu). The reforecasts uses time varying LULC and climatological LAI based on version climate.v020_ESACCI_LAI of the IFS climate fields and can be compared against the CONTROL experiment (i14x) that uses climatological LAI and fixed LULC.
Interval/period: N/A

Interval/period: N/A
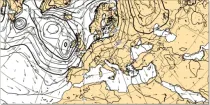
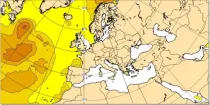
These charts show surface pressure patterns. Areas of high pressure (anticyclones) are usually associated with settled weather...
Interval/period: N/A
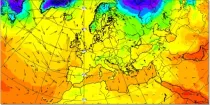
Dew Point Temperature at 2 m above the earth’s surface gives an indication of conditions which a person will experience or feel. High dewpoint temperatures inhibit heat loss from the body by perspriation and...
Interval/period: N/A
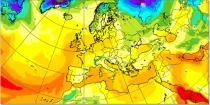
Temperatures at 2 m above the earth’s surface and winds at 10 m above the earth’s surface approximate most closely to the conditions that a person would experience.
Interval/period: N/A
The 850 hPa level is usually just above the boundary layer and at this level the day-night variation in temperature is generally negligible...
Interval/period: N/A

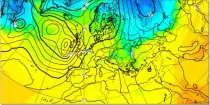
Wind speed at 200 hPa highlights the jet stream (areas of strong winds in the upper troposphere) which can help identify movement and development of depressions...
Interval/period: N/A

Wind speeds near the surface are roughly proportional to the distance between isobars so closely packed isobars mean strong surface winds...
Interval/period: N/A
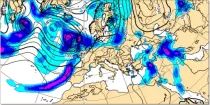
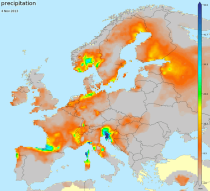
Precipitation totals include all precipitation types (rain, snow etc.) (in mm of rainfall or rainfall equivalent) falling in 6 hour or 12 hour periods using colour shading...
Interval/period: N/A
Significant wave height can be shown to correspond to the average wave height of the top one-third highest waves. The wave period of windsea is generally <10s,...
Interval/period: N/A
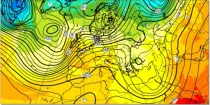
In the northern hemisphere the air rotates anti-clockwise around low contour centres and clockwise around the high contour centres. In the southern hemisphere the air rotates clockwise around low contour centres and ...
Interval/period: N/A
Total accumulated rainfall charts identify areas at greater risk of significant rainfall (or rain equivalent e.g.snowfall) but give no information regarding whether this occurs over a short or prolonged time period...
Interval/period: N/A
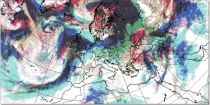
This display helps with the recognition of clouds of different layers, even when they overlap. Brighter colouring represents greater cloud cover. Cloud-free areas appear white while areas of full cloud cover at all levels appear dark grey (e.g. active fronts)...
Interval/period: N/A