Datasets
**Note:** In **June 2023** ECMWF implemented a **major upgrade ...**
Interval/period: N/A
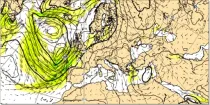
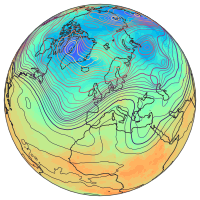
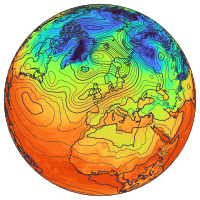
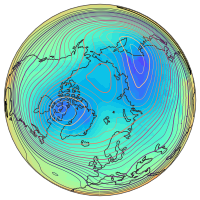
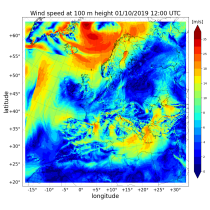
The air flow is not the same at all levels and can be very different in strength and direction when associated with vigorous weather systems...
Interval/period: N/A
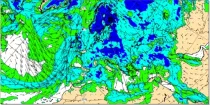
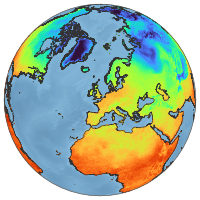
Uncoloured areas (relative humidity < 65%) are likely to be free of cloud. Coloured areas (relative humidity > 65%) show where moisture is likely to be available for cloud development...
Interval/period: N/A
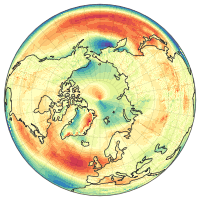
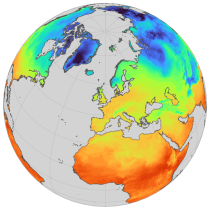
This chart shows 7-day mean anomalies of wind speed and direction from the ECMWF Sub-seasonal ...
Interval/period: N/A

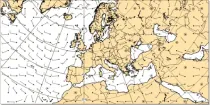
Mean windsea wave direction is the spectrally averaged direction of propagation of the windsea waves (weighted by wave height). Arrow length is proportional to the speed of wave propagation...
Interval/period: N/A

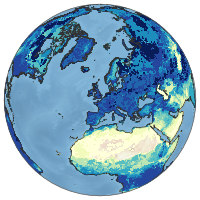
Significant windsea wave height can be shown to correspond to the average wave height of the top one-third highest windsea waves. Wave heights are shown in metres using colour shading...
Interval/period: N/A
Interval/period: Thu, 02/01/1940 - Fri, 01/23/2026
Interval/period: Sat, 03/01/1986 - Wed, 11/30/2011
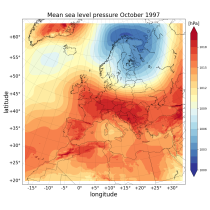
Data is available from 1940 onwards.
ERA5 replaces the ERA-Interim reanalysis.
Interval/period: Mon, 01/01/1940 - Thu, 06/25/2026
Data is available from 1940 onwards.
ERA5 replaces the ERA-Interim reanalysis.
Interval/period: Mon, 01/01/1940 - Thu, 06/25/2026
Data is available from 1940 onwards.
ERA5 replaces the ERA-Interim reanalysis.
Interval/period: Mon, 01/01/1940 - Fri, 05/01/2026
Data is available from 1940 onwards.
ERA5 replaces the ERA-Interim reanalysis.
Interval/period: Mon, 01/01/1940 - Fri, 05/01/2026
Data is available from 1940 onwards.
ERA5 replaces the ERA-Interim reanalysis.
Interval/period: Mon, 01/01/1940 - Thu, 06/25/2026
Data is available from 1940 onwards.
ERA5 replaces the ERA-Interim reanalysis.
Interval/period: Mon, 01/01/1940 - Thu, 06/25/2026
Interval/period: Sun, 01/01/1950 - Thu, 06/25/2026
Interval/period: Sun, 01/01/1950 - Fri, 05/01/2026
Interval/period: Sun, 01/01/1950 - Thu, 06/25/2026
Interval/period: Mon, 01/01/1979 - Fri, 05/01/2026

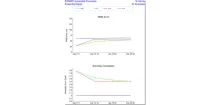
EXPECT seasonal hindcast experiment ConstantCO2/ocean. CO2 emissions kept constant at 1993 levels and warming footprint removed from ocean initial conditions. (For full details see Mayer et al. 2026). Experiment uses Cy49R2 v8 at Tco199 and ORCA025Z75 resolution (the reference ocean ICs are from ORAS6 0001). 51 member ensemble of May initialisations for the years 1993-2026 and run for 7 months.
Examples
Interval/period: N/A
EXPECT seasonal hindcast experiment Double delta CO2/ocean. Doubles the forced pattern of climate change in the ocean ICs after 1993 and doubles the annual rate of CO2 increase after 1993 . (For full details see Mayer et al. 2026). Experiment uses Cy49R2 v8 at Tco199 and ORCA025Z75 resolution (the reference ocean ICs are from ORAS6 0001). 51 member ensemble of May initialisations for the years 1993-2026 and run for 7 months.
Examples
Interval/period: N/A
Interval/period: Thu, 01/01/2004 - Tue, 06/30/2026
Interval/period: Sat, 09/01/1984 - Tue, 03/31/2026
Interval/period: Sat, 09/01/1984 - Tue, 03/31/2026
Interval/period: Sat, 09/01/1984 - Tue, 03/31/2026
Interval/period: Sat, 09/01/1984 - Tue, 03/31/2026