Datasets
Interval/period: Tue, 09/01/1981 - Sun, 12/01/2024
Interval/period: Mon, 01/01/1979 - Mon, 06/30/2025
This chart shows probabilities for the 7-day mean anomalies of surface temperature to be in ...
Interval/period: N/A
This chart shows probabilities that 7-day mean surface temperatures (from the 101 forecast ...
Interval/period: N/A
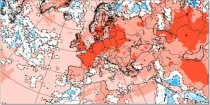
This chart shows 7-day mean anomalies of surface temperature from the ECMWF Sub-seasonal range ...
Interval/period: N/A
Interval/period: Wed, 01/01/1986 - Wed, 11/30/2011

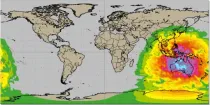
Standalone ecWAM wave model CY50R1 forced by corrected ERA5 hourly neutral 10m winds, air density, gustiness and sea ice fraction (1979-1989). Native grid is Tco1279 (9km), 36 directions, 36 frequencies. See Bidlot et al. 2026: Wave Hindcast for ERA6 Preparation and Training Data Driven Models. ECMWF Tech Memo, in preparation, 6-hourly output, many parameters.
Interval/period: N/A
Standalone ecWAM wave model CY50R1 with altimeter wave height assimilation forced by corrected ERA5 hourly neutral 10m winds, air density, gustiness and sea ice fraction (1990-1999). Native grid is Tco1279 (9km), 36 directions, 36 frequencies. See Bidlot et al. 2026: Wave Hindcast for ERA6 Preparation and Training Data Driven Models. ECMWF Tech Memo, in preparation, 6-hourly output, many parameters.
Interval/period: N/A
Standalone ecWAM wave model CY50R1 with altimeter wave height assimilation forced by corrected ERA5 hourly neutral 10m winds, air density, gustiness and sea ice fraction (2000-2015). Native grid is Tco1279 (9km), 36 directions, 36 frequencies. See Bidlot et al. 2026: Wave Hindcast for ERA6 Preparation and Training Data Driven Models. ECMWF Tech Memo, in preparation, 6-hourly output, many parameters.
Interval/period: N/A
Standalone ecWAM wave model CY50R1 with altimeter wave height assimilation forced by corrected ERA5 hourly neutral 10m winds, air density, gustiness and sea ice fraction (2016-2023). Native grid is Tco1279 (9km), 36 directions, 36 frequencies. See Bidlot et al. 2026: Wave Hindcast for ERA6 Preparation and Training Data Driven Models. ECMWF Tech Memo, in preparation, 6-hourly output, many parameters.
Interval/period: N/A

An eddy-permitting ocean reanalysis spanning the period 1979–2012. Includes increased horizontal and vertical resolution, an prognostic sea-ice component, new versions of the ocean and data assimilation system, revised surface fluxes, new version and treatment of satellite sea surface height data, and assimilation of sea-ice concentration, among others.
Interval/period: N/A
Uses a sophisticated data assimilation methodology which includes a model bias correction. The ocean model used is forced by atmospheric daily surface fluxes, relaxed to SST and bias corrected.
Interval/period: N/A
The ECMWF OCEAN5 system is a new global eddy-permitting ocean-sea ice ensemble reanalysis analysis system. This Technical Memorandum gives a full description of the OCEAN5 system, with the focus on its Behind-Real-Time (BRT) component, the reanalysis product ORAS5. The OCEAN5 Real-Time (RT) component includes all upgrades developed for ORAS5 and runs daily using the latest observations and forcing fields from the operational Numerical Weather Prediction (NWP).
Interval/period: N/A
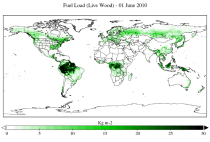
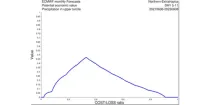
The two main variable groups are fuel load and fuel moisture, both of which are further divided by live/dead and wood/foliage fractions.
The dataset combines state-of-the-art model data (ERA5-Land) with observations from multiple satellites and in-situ variables into a globally complete and consistent dataset.
Interval/period: Wed, 01/01/2003 - Fri, 12/31/2021
**Note:** In **June 2023** ECMWF implemented a **major upgrade ...**
Interval/period: N/A
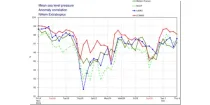
These diagrams compare recent ECMWF verification scores for Mean Sea Level Pressure with ...
Interval/period: N/A
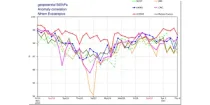
These diagrams compare recent ECMWF verification scores for 500 hPa height with those of other ...
Interval/period: N/A
This diagram shows mean and standard deviation of errors in the HRES forecasts for several ...
Interval/period: N/A
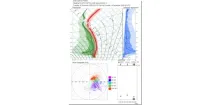
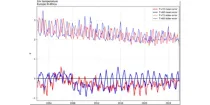
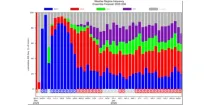
The Vertical Profiles display the vertical structure of the forecast model atmosphere in a familiar user friendly way. The vertical structure of temperatures (red) dewpoints (green) and dewpoint depressions (blue) from each ENS member ...
Interval/period: N/A
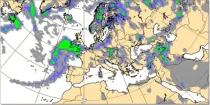
Predicting near surface visibility is dependent on predicting the correct dynamic and thermodynamic conditions in the boundary layer which can be highly variable. Fog is an extremely important weather hazard...
Interval/period: N/A
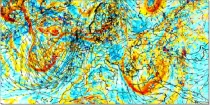
The movement or transfer of vorticity helps in the assessment of vertical motion of air (ascent) in the troposphere. Where a local vorticity maximum approaches an area there is a tendency for air to rise and where a local vorticity maximum moves ...
Interval/period: N/A
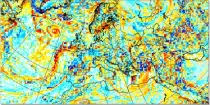
Vorticity is the tendency of an air particle to rotate or circulate around a particular point. Relative Vorticity is a measure about a vertical axis of the local rotation or spin of the air relative...
Interval/period: N/A
This diagram shows daily probabilities for four types of Euro-Atlantic weather regimes over ...
Interval/period: N/A
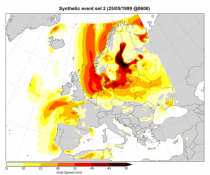
The DestinE Digital Twin for Weather-Induced Extremes (Extremes DT) supports responding and adapting to extreme events in a changing world by providing a capability to produce tailored simulations and address what-if scenarios related to extreme events in a past, present and future climate, complementing existing capabilities at national and European level.
Interval/period: N/A