Datasets
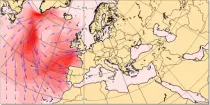
These charts show the the wave energy flux (in kW m⁻¹) calculated as the integral, over all forecast wave frequencies and wave directions, of the product of the wave group speed and the two-dimensional energy wave spectrum...
Interval/period: N/A
Interval/period: Wed, 01/01/1958 - Wed, 01/01/2025
The height of topography above mean sea level and the depth of the sea for each model grid box ...
Interval/period: N/A
Interval/period: Wed, 04/01/1970 - Tue, 07/01/2025

4-month long 101-ensemble member seasonal attribution experiment (PC98) initialised on 01-November-1997 using the atmosphere-only version of SEAS5 (see Johnson et al., 2019) forced with daily ERA5 SST as in the reference experiment (R98) but with daily SST climatology over the tropical Pacific Ocean.
Examples
Interval/period: N/A
4-month long 101-ensemble member seasonal attribution experiment (PC16) initialised on 01-November-2015 using the atmosphere-only version of SEAS5 (see Johnson et al., 2019) forced with daily ERA5 SST as in the reference experiment (R16) but with daily SST climatology over the tropical Pacific Ocean.
Examples
Interval/period: N/A
4-month long 101-ensemble member seasonal attribution experiment (PC20) initialised on 01-November-2019 using the atmosphere-only version of SEAS5 (see Johnson et al., 2019) forced with daily ERA5 SST as in the reference experiment (R20) but with daily SST climatology over the tropical Pacific Ocean.
Examples
Interval/period: N/A
Interval/period: Tue, 10/01/1985 - Wed, 12/31/2025
Interval/period: Sun, 09/01/1985 - Wed, 12/31/2025
Polar relaxation experiment run at Tco199 for 46 days over 20 years starting on 12, 16 , 19, 23, 26 , 30 December and 2nd, 6th and 9th January 1999-2018.
Examples
retrieve, class=rd, stream=enfh, expver=iknn, type=pf, number=1/to/4, levtype=sfc, param=2t, date=20191212, hdate=20091212, time=00:00:00, step=24, target='output.grib'Retrieving 2-meter temperature of the hindcast starting on 12 December 2019 for all perturbed members.
Interval/period: N/A
These charts show MSLP and 850hPa forecasts for the Ensemble Control Forecast, and 50 ENS ...
Interval/period: N/A
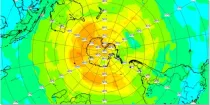
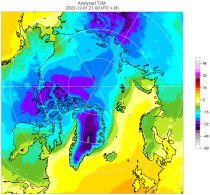
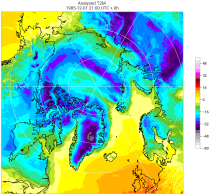
Potential vorticity (PV) helps description and understanding of dynamic processes in the atmosphere by giving an indication of ascending or descending air flows and the development or weakening of ...
Interval/period: N/A
Forecasts using IFS EPS CY47R2 replicating operations (51 members, TCo639, ORCA025Z75). The CO2 concentration was set to 285 ppm. If you are interested in using these data, please let us know by contacting nicholas.leach@physics.ox.ac.uk .
Examples
Interval/period: N/A
Forecasts using IFS EPS CY47R3 replicating operations (51 members, TCo639, ORCA025Z75). The ocean state has had a hydrostatically balanced estimate of anthropogenic influence (warming) since 1850-1900 removed. The CO2 concentration was set to 285 ppm.
Interval/period: N/A
Forecasts using IFS EPS CY47R2 replicating operations (51 members, TCo639, ORCA025Z75). The ocean state has had a hydrostatically balanced estimate of anthropogenic influence (warming) since 1850-1900 removed. The CO2 concentration was set to 285 ppm If you are interested in using these data, please let us know by contacting nicholas.leach@physics.ox.ac.uk .
Examples
Interval/period: N/A
Forecasts using IFS EPS CY47R2 replicating operations (51 members, TCo639, ORCA025Z75). The ocean state has had a hydrostatically balanced estimate of anthropogenic influence (warming) within the CMCC-CM2-HR4 climate model since 1850-1900 removed. The CO2 concentration was set to 285 ppm. If you are interested in using these data, please let us know by contacting nicholas.leach@physics.ox.ac.uk .
Examples
Interval/period: N/A
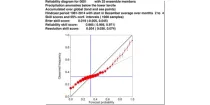
The reliability diagram shows the reliability of the ECMWF seasonal forecast system (SEAS5) with ...
Interval/period: N/A
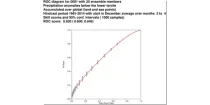
This chart shows the Relative Operating Characteristics (ROC) diagram for the three-month ...
Interval/period: N/A
Interval/period: Tue, 10/01/2002 - Mon, 06/30/2025
A 49R1 forecast experiment has been run to generate model fields which can be used to run an offline forward operator for polarimetric radio occultation observations. The fields include convective snow and rain, which are not a standard output for operations. The dates fit to Atmospheric River and Tropical Cyclone cases used for testing the forward operator generating simulated PRO fields (dPhi) and comparing them to observed ones.
Examples
Interval/period: N/A
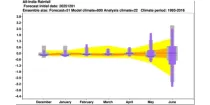
The ECMWF seasonal forecasts (SEAS5) are produced every month with a 51-member ensemble at ...
Interval/period: N/A
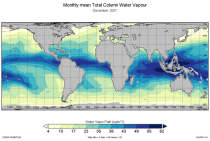
This catalogue entry provides the TCWV data product usually called Hamburg Ocean Atmosphere Parameters and Fluxes from Satellite Data (HOAPS).
Interval/period: Wed, 05/01/2002 - Thu, 03/01/2012