
El Niño, the cyclical warming of surface waters in the central and eastern Pacific, and its counterpart, La Niña – the cooling phase – together form the El Niño–Southern Oscillation cycle (ENSO), a key driver of global weather.
Interest in El Niño is currently particularly high. In its latest update, the World Meteorological Organization (WMO) indicates an approximately 80% likelihood of El Niño conditions developing during June—August 2026.
Tracking El Niño traditionally relies on monitoring the sea-surface temperature (SST) anomalies in the Niño 3.4 region and comparing them with typical conditions.
However, as the climate warms, interpreting these anomalies becomes more challenging. Rising background temperatures can make recent El Niño events appear stronger, and La Niña events weaker.
To address this, with the support of the WMO, ECMWF is introducing an additional measure of El Niño strength, alongside the more traditional Niño 3.4 SST anomalies, in its seasonal forecast from 1 June 2026: the Relative Niño indices.
These indices compare the Niño 3.4 region with the rest of the tropics at the same time, offering a perspective that is less sensitive to long-term warming.
This will provide an additional tool for describing the likely strength of an upcoming El Niño event. Even with this adjustment, current forecasts suggest that El Niño may be unusually strong later in the year.

Anomalies and extremes in sea surface temperature for May 2026. Colour categories refer to the percentiles of the temperature distributions for the 1991–2020 reference period. The extreme (“Coolest” and “Warmest”) categories are based on May rankings for the period 1979–2026. Values are calculated only for the ice-free oceans. Areas covered with sea ice and ice shelves in May 2026 are shown in light grey. The map outlines the Niño 3.4 region used to monitor El Niño conditions.
Data source: ERA5. Credit: C3S/ECMWF
Motivation for change
The traditional method of measuring El Niño uses an index based on the average value of SST across a large region of the equatorial Pacific, the so-called Niño 3.4 region (5°N—5°S, 120°W—170°W).
The average SST for a given month is compared to a climatological mean value, typically based on a 30-year period, to give an anomaly relative to that climatology. This approach has been used for many decades by the international community and is suitable when the climate is either stationary or changing only very slowly.
However, global and tropical temperatures are now warming fast enough that this approach has some drawbacks.
The size of Niño 3.4 SST anomalies depends on which period is used to define the climatology, since the 30-year mean values defining the climate have been increasing by about 0.1°C per decade. Also, the general level of warming in the tropics also makes it easier to reach high absolute SSTs during El Niño events, and harder to reach cold temperatures during La Niña events (periods of significantly negative Niño 3.4 SST anomalies). Thus, whichever fixed climate period is used, anomalies show a tendency for stronger El Niños and weaker La Niñas in recent years.
But is it fair to say that El Niño events are becoming stronger, and La Niña events weaker?
El Niño variability arises from coupled variations in oceanic and atmospheric dynamics, involving equatorial winds, oceanic upwelling and heat budgets, and changes in the location of tropical deep convection. These processes depend more on spatial temperature differences across the tropics than on absolute temperatures.
This motivated the concept of Relative Niño indices, which are defined as spatial anomalies – measuring how warm an index region is compared to the tropics as a whole at the same point in time – rather than temporal anomalies, which measure how warm the index region is compared to the same location at different times.
Defining the Relative Niño index
We define a Relative Niño index, RNINOanom as follows:

Where NINO is the SST in the index region, TROP is the average SST across the tropical region 20°N–20°S, and s is a scaling factor.
To express our relative Niño index as an anomaly, we remove the mean climate of the (NINO - TROP) difference over a reference period, in our case 1991-2020. If the Niño region and the tropics have the same temperature trend, then the choice of reference period has little effect. In this sense, the Relative index is much less sensitive to global warming than the traditional index.
However, if the Niño region has a different temperature trend to the rest of the tropics, the choice of reference period makes a difference, meaning the Relative index is not totally immune from climate change. Long-term changes in the Relative index would reflect long-term changes in the spatial pattern of tropical SSTs, which would inevitably be associated with changes in atmospheric circulation. This is a dependence of the Relative index on climate that we are happy to include in the definition.
Why a scaling factor is needed
The scaling factor, s, is introduced so that the Relative Niño index has the same amplitude of variability as the corresponding traditional Niño index. This is to make the new indices easy to use in any existing decision processes, effectively replacing the traditional index.
A different scaling factor must be used for each calendar month. The decision to use such a scaling factor has been agreed during WMO discussions, in consultation with operational services and forecast centres around the world. We calculate the scaling factor, s, as:

Where σ is the standard deviation of the index for a given calendar month. We estimate this over a 50-year period (1971-2020), and we choose to linearly detrend both time-series to reduce any contamination from temperature trends, although this makes very little difference at times of the year when Niño anomalies are large.
Some observed SST datasets have higher levels of smoothing than others, which means that the variance of Niño anomalies is slightly lower. To remain consistent, scaling factors should be appropriate for the dataset being used. At ECMWF, scaling factors are derived using high-resolution SST datasets that capture El Niño peak amplitudes well, and are considered suitable for both our observational and model-derived Niño indices.
The scaling factor represents a physical reality: when SST in e.g. the Niño 3.4 region warms up, the tropical-mean SST also warms, because the Niño 3.4 region is included in the tropical mean. Thus, the difference between the Nino region and the tropical mean NINOanom - TROPanom is always smaller than the NINO anomaly NINOanom alone so a scaling factor, s, greater than 1 is required.
In fact, El Niño warming extends beyond the Niño 3.4 region. As an El Niño event matures and eventually starts to decay, El Niño- induced warming spreads across the tropics. This results in a scaling factor which varies with season (Figure 1). Values are relatively low in July and August, when an El Niño event is typically in the early stage of development, and are high in March and April, when tropic-wide warming is still present, but the anomaly in the core Niño 3.4 region is weakening.

Figure 1: The scaling factor used at ECMWF for the Niño 3.4 region, calculated as a function of calendar month.
Because the scaling factor is a ratio of two standard deviations, it is reasonable to question how accurately it can be estimated from only a 50-year sample. However, the physical nature of the relationship means that the ratio is relatively stable. Additionally, the chosen period has a high amplitude of El Niño variability, which also helps us obtain an accurate estimate of the scaling factor.
How does the Relative Niño index compare?
Comparisons between the traditional and Relative Niño 3.4 SST anomalies show that the two are highly correlated (Figure 2). However, there is a clear difference in trend: for early years, the Relative index is higher, and for later years it is lower.
Apart from this trend difference, there is very good agreement on the amplitude of El Niño peaks and La Nina troughs, indicating that the scaling factor is working well.
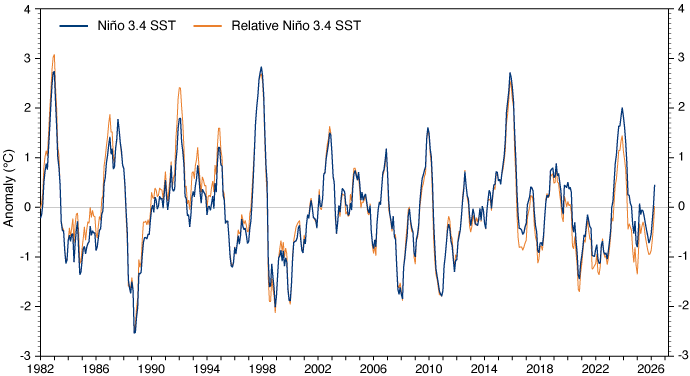
Figure 2: Niño 3.4 and Relative Niño 3.4 SST anomalies for 1982 to early 2026. Both indices are calculated from the ERA5 SST dataset, and are relative to a 1991-2020 climatology.
Some differences are expected: even if there is no anomaly in the Pacific, anomalous SST elsewhere, such as the Atlantic or Indian Oceans, can change the value of the tropical mean SST, and hence the value of the Relative Niño index. This can be considered a source of noise in the Relative Niño index, as it is unrelated to El Niño variability.
The most recent El Niño in 2023 is about 0.5°C weaker in the Relative index, while the La Niña conditions of 2024 and 2025 are stronger. These changes reflect the intended effect of the Relative index, which provides a more appropriate description of El Niño and La Niña in the context of a warming tropical background.
From 1 June 2026, the Relative Niño indices have been added to ECMWF’s operational forecast plots from SEAS5. Relative versions of all four Niño indices (Niño 3.4, Niño 1+2, Niño 3 and Niño 4) have been calculated, with the same methodology to calculate an appropriate set of scaling factors for each of them. Forecasts of the Relative index are typically 0.5°C cooler than those of the traditional index. However, it is not a simple offset as each ensemble member has a different tropical mean SST, meaning each ensemble member is shifted by a different amount.
What are the limitations of a Relative Niño index?
A relative Niño index has some definite advantages, but it is not a panacea.
Firstly, El Niño variability cannot be described by a single number. Every El Niño event is different in terms of the detailed pattern of SST anomalies that emerges. In addition, the atmospheric response depends on the distribution of SST elsewhere in the tropics, as well as other sources of predictability in the climate system. When considering the likely impacts of an El Niño, this wider, multi-dimensional context must be accounted for.
Secondly, the Relative Niño index is sensitive to conditions outside the equatorial Pacific. Changes in the tropical Atlantic and Indian Oceans will alter the Relative Niño index, even if they are completely unrelated to El Niño. This can be thought of as adding a certain amount of “noise” to an index designed to measure El Niño variability.
Finally, while the Relative index largely removes the global warming signal from the Niño indices, this does not mean that global warming has been removed from the climate system. Absolute temperatures in the tropics have increased substantially over recent decades, and the absolute value of SST is a key determinant of evaporation, air temperature, the transport of moisture and the release of latent heat. All of these are increased as the tropics warm, and both the response of the atmosphere to a given spatial pattern of SST anomalies and the subsequent impacts will differ as a consequence.
We come back to our inability to use one number to describe El Niño and its expected impacts: there is no simple and accurate method to compare present day El Niño events with those of decades ago.
Which observational estimate of SST do we use?
Astute observers will notice that “observed” values of Niño indices can differ depending on the source. This is true for both traditional and relative indices, and stems from differences in the underlying SST data. Sea-surface temperature is not perfectly known, particularly for decades in the past with no or limited satellite data. Different SST products use different calibration methods and different ways of dealing with the limitations of past data.
We use the ERA5 SST as the observational reference for SEAS5; this is based on a relatively high-resolution SST products, such as the Met Office's Hadley Centre Sea Ice and Sea Surface Temperature data set (HadISST) and the Operational Sea Surface Temperature and Ice Analysis (OSTIA) system, which capture the full amplitude of variability in the Niño 3.4 area-averaged SST, albeit at the expense of including a little noise in earlier years.
For the forthcoming SEAS6 system, we will switch to using the SST used as input to ERA6 (ESACCIv3, OSTIA), which has similar characteristics but is considered to be a little more accurate.
Other Niño indices, notably the Oceanic Niño Index (ONI) used by the Climate Prediction Center (CPC)/National Oceanic and Atmospheric Administration (NOAA), are based on a smoother, lower-resolution SST dataset (ERSSTv5), designed to allow consistent analysis back as far as the nineteenth century. This dataset has lower peaks for some of the major El Nino events of recent decades. This should be borne in mind if comparing ECMWF values to analyses produced elsewhere, or forecasts which have been tuned to such analyses.
Evolving ENSO monitoring
The introduction of Relative Niño indices provides a valuable perspective on ENSO variability, helping to place El Niño and La Niña events in the context of a warming climate. By focusing on spatial differences across the tropics, these indices reduce sensitivity to long-term temperature trends while complementing existing measures.
Developed as part of a broad international effort and recommended by the WMO, the new index is expected to be readily adopted. Its arrival is timely, with current indicators pointing to a potentially significant El Niño event – possibly among the strongest seen in the past 50 years – underlining the importance of improved tools to monitor one of the climate system’s most influential drivers.