
As periods of extreme heat become more frequent and intense around the world, the question is no longer just how hot it will get, but how that heat will be experienced by people.
We recently highlighted how heat stress is intensifying globally, with hazardous heat becoming more frequent, more severe and longer lasting than in previous decades.
Importantly, this reflects more than rising air temperatures alone. Factors such as humidity, wind speed and solar radiation all shape how weather conditions are physically experienced by the human body, influencing how dangerous they may become. This is where heat stress forecasting becomes increasingly relevant.
Beyond air temperature
ECMWF provides a variety of products based on heat and cold stress indices – available to all in OpenCharts. They include the heat index, humidex, Universal Thermal Climate Index (UTCI), Wet Bulb Globe Temperature (WBGT), and wind chill factor.
Each is designed to translate weather conditions into something closer to human experience: not just what the air temperature is, but how the atmosphere is likely to feel to the body.
Thermal stress indices estimate the interaction between the outdoor environment – air temperature, humidity, wind speed and radiation – and the human body.
They are best understood as contextual forecast information rather than as direct guidance, warnings or recommendations, which remain the responsibility of national meteorological services and are co-constructions with national health authorities. Nor are they precise substitutes for individual exposure or medical risk, which can vary substantially from person to person.
This year’s Using ECMWF's Forecasts event (UEF2026) broader theme was extreme temperature forecasting and how temperature information is translated into action across timescales and applications.
During discussions after my presentation on ECMWF’s operational forecasts of human heat and cold stress indices, the conversation moved quickly beyond the science towards operations: how these thermal comfort forecast products are already being used, how they are interpreted, and what makes them useful in practice.
How thermal stress forecasts are used worldwide
These discussions raised an interesting question for me: what is the role of a global thermal stress product when decisions are ultimately made at national, local, and even individual level?
To explore this, I reviewed publicly available forecast products from national meteorological services around the world to understand where thermal stress information is already being used operationally. This was not intended as a formal audit, but as a practical snapshot.
National meteorological services are especially relevant because they are often where forecast information moves from numerical output into public guidance, warnings and decision support.
My review suggested that 61 countries display some form of thermal stress index in operational products, either as daily observations, forecasts, or both. Here, “display” refers to products that are publicly visible through national meteorological service websites or associated operational platforms. The result should therefore be interpreted as indicative rather than exhaustive, but it still provides a useful picture of current operational practice.
Because the review was based on publicly accessible sources, it may not capture indices used internally, and countries not identified should not be assumed not to use thermal stress indices operationally.
The thermal stress indices are not confined to one region or climate zone: their use spans all WMO regions and includes services in Europe, Asia, Africa, the Americas and Oceania.
Temperature–humidity-based indices are especially prominent in warm and humid climates, as might be expected, but the operational use of thermal stress products extends well beyond the tropics. In cooler climates, services often complement heat-focused indices with wind chill products.
In terms of the types of indices being used, the heat index is the most widely adopted worldwide, followed by the WBGT and UTCI, with many services also offering less tightly defined “feels like”, “apparent”, or “perceived” temperature products (Figure 1). That mix is revealing, suggesting a balance between two needs: simple products that are intuitive and easy to communicate, and indices that better capture the complexity of thermal stress because they are more physically or physiologically grounded, or because their terminology points in that direction.
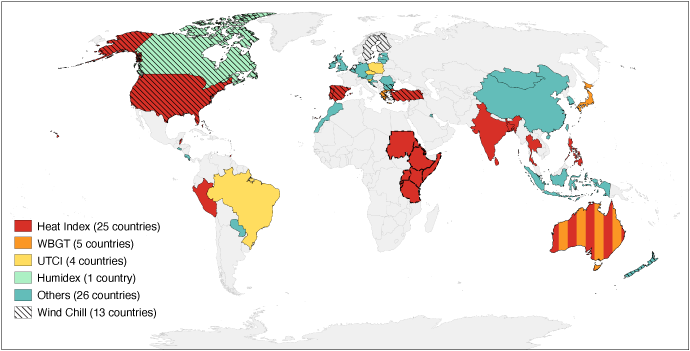
Figure 1: Where and which thermal stress indices are used by national meteorological services across the globe. The dashed line indicates the ICPAC (IGAD Climate Prediction and Applications Centre) area. The map is based on publicly accessible sources and may not capture indices used internally; countries not highlighted should not be assumed not to use thermal stress indices operationally.
In 43 countries, the indices are forecast operationally, and their lead time is another important part of the story.
Short lead times dominate, with 25 countries forecasting thermal stress indices at 1 to 3 days, 10 countries at 4 to 7 days, and 8 countries out to 10 days (Figure 2). This is consistent with thermal stress products being framed as highly actionable guidance for the coming few days, when decisions about work, sport, health services and outdoor activity are most immediate.
At the same time, the lead time extension of these products to around 10 days is notable. I believe this points to growing confidence that thermal stress information can support decisions and planning further ahead, provided users understand the associated uncertainty.
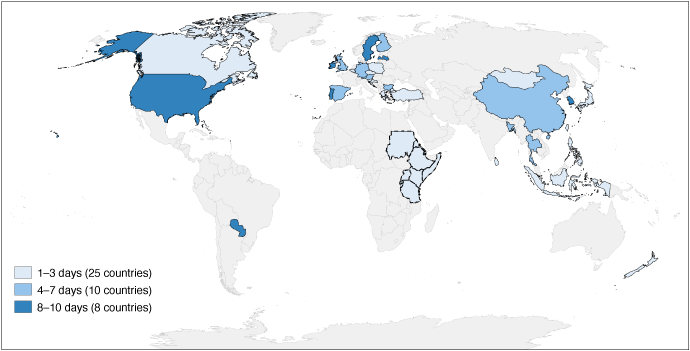
Figure 2: Maximum lead time for the indices forecast in Figure 1. The dashed line indicates the ICPAC (IGAD Climate Prediction and Applications Centre) area.
Building better human-centred forecasts
Most of the indices being used are fundamentally built on air temperature and humidity, while wind and radiation are included in indices such as the WBGT and UTCI. At ECMWF, air temperature at 2 metres is treated as a fundamental forecast variable.
One presentation at UEF2026 highlighted how many interacting processes affect air temperature, including land–atmosphere exchanges, turbulence and clouds. It also showed how assimilating observations has a lasting impact on forecasts: removing soil moisture and temperature analysis can significantly degrade air temperature forecast skill. Relative humidity at weather station level is also part of the land data assimilation framework.
Thermal stress forecasting therefore relies on the same ongoing advances in near-surface meteorology that underpin improvements in temperature forecasts more generally. This matters directly, because if the input variables improve, the indices derived from them become more reliable too.
By translating outdoor environmental conditions into something closer to human experience, weather forecasts can be connected more directly to the decisions that people actually make. They can support better judgements about outdoor work, health protection, physical activity and exposure to hazardous conditions, particularly for vulnerable groups.
At the same time, these indices are built on assumptions, cannot fully capture local variability, and do not account for the wide differences in how individuals respond based on age, fitness, acclimatisation, health status or behaviour.
This is exactly why dialogue with users matters so much. A global product has value not because it removes local complexity, but because it provides a scientifically consistent starting point that local services and users can adapt, contextualise and apply. That, perhaps, was the most useful takeaway from my conversations at UEF2026. Some users are already integrating thermal stress information into operations. Others are thinking about how to do so. In both cases, the same principle emerged: if forecasts are to support people more directly, we need products that move beyond describing the atmosphere in isolation and instead speak to how weather is experienced.
Global forecasts of human heat and cold stress are one way of doing that. Looking at how the same challenge is approached locally shows both how much progress has already been made and how much we can learn from one another.
If your country is missing from the map, or if you know of an operational thermal stress product that should be included, I would be glad to hear from you via this Microsoft Form.
Acknowledgements
The review of publicly available forecast products was conducted using Microsoft Copilot.
Top banner image: © Rattanapol Satittanapat / iStock / Getty Images Plus