

© Paopano / Adobe Stock
Authors: Mohamed Dahoui, Steve English, Niels Bormann, David Lavers, Umberto Modigliani
Behind every weather forecast lie millions of observations gathered from a global network of satellites, aircraft, ships, buoys and other instruments that continuously monitor the atmosphere, oceans, and land surface.
These observations provide the starting point for weather prediction models. They also play an important role after the forecast has been made, helping forecasters to verify how well the forecast captured the weather that actually occurred.
But not every measurement is equally trustworthy, and observation quality can change over time as instruments age and become less accurate, sensors fail, maintenance affects operations, and radiofrequency interferences occur. Because forecasts depend on the quality of the data that feed them, observations must be checked and have their errors well characterised.
Every week, sometimes every day, something happens that impacts observation quality. We need to be able to spot these issues, respond, decide whether to still use the observations, correcting for issues if possible, test changes and keep the operational forecast system both safe and continuously supplied with high-quality observations. And this must be done very quickly. This is a huge amount of work that is not always seen but is vital to maintaining the quality that users of operational forecasts need and expect.
Monitoring observations throughout their lifecycle
Observation monitoring begins before an observing system is routinely used and continues throughout its operational lifetime.
New types of observations are evaluated to understand their characteristics and how they behave within the forecasting system. Once an observing system is in active use, monitoring becomes a continuous process, tracking its quality, availability and consistency and looking for changes that could affect forecasts.
“Observation quality is not assessed once and then forgotten. We instead build up a picture of how different observing systems behave over time,” said Mohamed Dahoui, Senior Scientist.
This long-term monitoring spans the full lifecycle of an observing system, from its initial rollout and evaluation through to its eventual retirement (Figure 1).
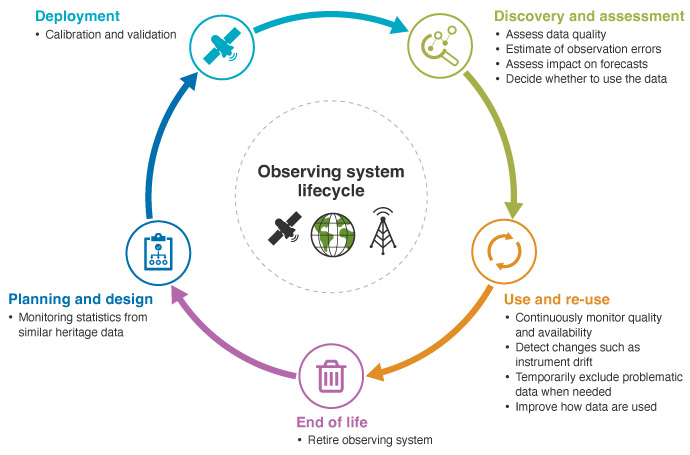
Figure 1: Diagram highlighting monitoring throughout the lifecycle of an observing system.
How do we know if an observation is trustworthy?
ECMWF’s monitoring process is based on detailed statistical information on the quality and availability of the different components of the observing system.
At the core of this are comparisons known as background departures. These measure the difference between what an instrument reports and what the model's short-range forecast – known as the background – expects at the same time and location.
The background is a physically consistent estimate of the Earth system state (atmosphere, ocean, land, sea ice), generated by the model forecast and informed indirectly by observations assimilated in previous forecast cycles.
Because the observation being evaluated has not yet been assimilated by the model, the comparison offers an objective way to assess how well it fits the wider picture.
In simple terms, background departures provide a way of asking: do these observations look like what the forecasting model expected to see?
"Every observation tells us something about the state of the atmosphere, but we also need to know how reliable that information is. Comparing observations with the model background helps us identify unusual behaviour early and build confidence in the data we use to produce forecasts," said Niels Bormann, Principal Scientist.
These departures are exploited in two complementary ways. Firstly, they are used to generate routine statistics that are computed regularly over time and by data type, instrument, or area to build up a picture of how each part of the observing system is evolving. These statistics are made available via the ECMWF observations monitoring web page. Secondly, they help to identify and diagnose anomalies, such as faulty observations.
As many weather forecasting centres use the same global observing system, comparing results helps provide a broader view of observation quality and performance. Other numerical weather prediction (NWP) centres have similar monitoring pages and regularly compare results to separate local processing issues from anomalies that impact everyone.
In addition, EUMETSAT’s Satellite Application Facility for Numerical Weather Prediction (NWP SAF) and Radio Occultation Meteorology Satellite Application Facility (ROM SAF) offer a useful web facility for comparing monitoring statistics across major NWP centres, making this kind of cross-checking easier.
With millions of observations arriving every day, it is not practical to check them all manually. Automatic anomaly detection, using background departures and other diagnostics, is therefore used to highlight data quality and availability issues.
In July 2026, for example, an observation from the ship ONLX was found to contain large position errors. Because the observation was assigned to the wrong location, it had a detrimental effect on the analysis of Tropical Cyclone Noul (Figure 2). Once the issue was identified and the affected observation removed, the analysis significantly improved.
Observations showing poor performance can be temporarily excluded from data assimilation while the issue is investigated and until their performance returns to an acceptable level.
The ECMWF observations dashboard shows, in near real time, the status of the observing system as received and used at ECMWF, including its composition and any availability or quality issues.
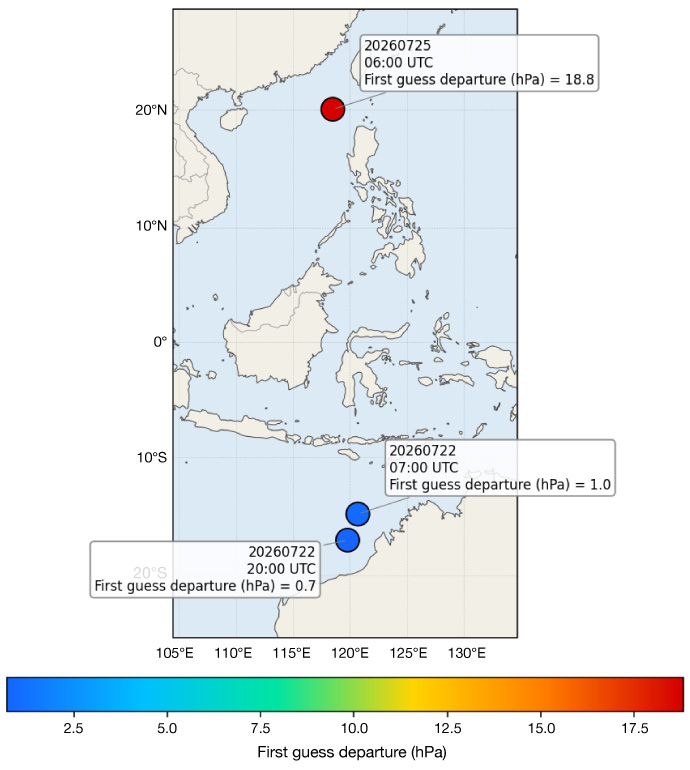
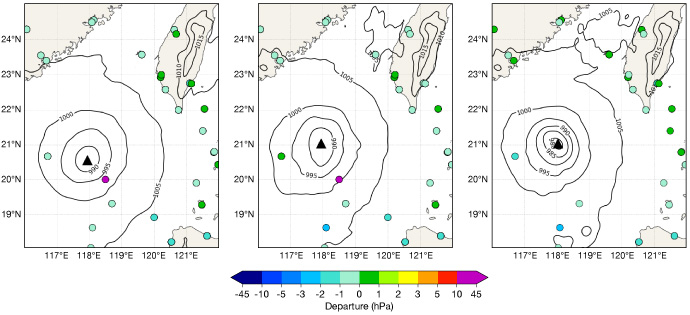
Figure 2: Ship ONLX was affected by large position errors (top) leading to a degradation of the tropical cyclone Noul analysis (25 July 2026, 00 UTC) (middle) compared with the first guess forecast (24 July, 18 UTC) (left). The removal of this observation improved the analysis as seen by a better-defined low-pressure centre (right). Black triangle indicates mean sea-level pressure minimum.
Monitoring to improve the forecasting system
Beyond identifying problems with individual observations, these statistics also help assess whether changes to the forecasting system are delivering the expected improvements. By comparing how well the model agrees with observations before and after an update, monitoring can show whether the system has improved and whether this improvement is also seen in independent observations.
Redundancy in the observing system provides another important source of insight. When several independent observation types, with similar sensitivity to the same atmospheric variable, show a coincident increase in their differences from the model, this is less likely to indicate a problem with any single instrument and may instead point to an issue with the model or background. Such a signal would be much harder to identify from any one data type alone.
“When different types of observations begin showing the same signal, we gain valuable evidence about whether the issue lies with the observations themselves or with the model,” said Mohamed Dahoui.
Working with data providers
Beyond selecting observations for data assimilation, monitoring also provides an important mechanism for giving feedback to data providers, including satellite agencies. This feedback can help identify and mitigate data quality and availability issues early, where possible, helping to maintain a reliable flow of high-quality observations for the wider weather forecasting community. Where issues cannot be resolved, stopping the affected data feed helps protect the wider user community by preventing poor-quality observations from being propagated to other users and applications.
"ECMWF's role goes beyond using observations. By continuously monitoring their quality and performance in forecasting systems, we provide data providers with independent feedback that helps improve observations at source, benefiting the entire weather forecasting community," said Umberto Modigliani, Deputy Director of Forecasts.
Monitoring is particularly valuable during the early commissioning of new satellites, when it can help assess the behaviour and quality of new observations against the consistent model background. This is a powerful tool for establishing whether instruments are performing as expected within the entire observing system used at an NWP centre. Any unexpected issues can often be addressed through improvements to data pre-processing, calibration, or other aspects of the data production chain. ECMWF works closely with all leading space agencies to identify and rectify such issues, to achieve the best-possible impact of the observations.
One example is the European Space Agency’s Aeolus wind satellite mission, proposed by Stoffelen et al. (2005); see also Kallen (2008). This mission was very impactful on the accuracy of weather forecasts but early monitoring showed unexpected biases (Rennie and Isaksen 2024). The comparisons to background were able to isolate this to gradients in temperature across the instrument’s primary mirror. NWP monitoring characterised the bias, and an operational bias correction was implemented in the ground processing system on 20 April 2020.
From monitoring to global coordination
ECMWF's observation monitoring activity makes an important contribution to improving the global observing system under the umbrella of the World Meteorological Organization (WMO). This collaboration includes regular reporting on data quality and availability, supporting the wider community both in selecting observations for data assimilation and in maintaining a consolidated set of trusted observations for verification.
"Monitoring the global observing system is a shared responsibility. ECMWF works with national weather services, space agencies and international partners such as EUMETNET in Europe to identify issues early, share knowledge openly, and strengthen the quality of observations that support forecasts worldwide," said Stephen English, Deputy Director of Research.
Whilst many centres monitor all their observations, sharing monitoring information offers significant benefits. It shows whether all centres are receiving the same observations in the same time window, and if one is not, this can be investigated. It can also show if a problem is local to one centre, so it is more likely an issue at that centre, rather than a problem with the quality of observations used by all centres.
In this context, ECMWF also operates and is a major contributor to the WMO WIGOS Data Quality Monitoring System (WDQMS), which monitors the availability and quality of land-based surface and upper-air observations. The system brings together near-real-time monitoring information from four global NWP centres: the German Meteorological Service (DWD), ECMWF, the Japan Meteorological Agency (JMA) and the US National Centers for Environmental Prediction (NCEP).
In addition to its contribution to WDQMS, ECMWF supports the monitoring of European in-situ observations under the umbrella of the EUMETNET Composite Observing System (EUCOS). EUCOS coordinates the surface and upper-air observing networks of EUMETNET's member states, helping to optimise their combined contribution to numerical weather prediction across Europe.
There are also similar coordinated efforts by the Science Working Groups of the Coordination Group for Meteorological Satellites (CGMS), where automatic alerts and other monitoring information at many NWP centres are shared, to enable better and faster characterisation of observation anomalies.
Monitoring observations in the field
ECMWF additionally supports observational campaigns, reflecting the interest in monitoring observations for forecasting and diagnostics.
A key example is Atmospheric River Reconnaissance (AR Recon), an operational programme during boreal winter across the North Pacific, Gulf of Mexico, and western North Atlantic.
ECMWF advises on the placement of new observations, such as dropsondes, and monitors and assimilates the resulting data, feeding back on its quality and running impact studies to assess its forecasting benefit.
ECMWF has provided similar support to the North Atlantic Waveguide, Dry Intrusion, and Downstream Impact Campaign (NAWDIC) over the North Atlantic and Europe.
This monitoring–assimilation–impact cycle also underpins the Global Drifter Program (Scripps Institution of Oceanography) and EUMETNET's Surface Marine programme (E-SurfMar), guiding the deployment of drifting buoys that augment marine observations.
Keeping the world’s observations fit for forecasting
Whether identifying faulty observations, supporting satellite agencies, contributing to international monitoring networks or helping design field campaigns, observation monitoring plays a vital role in modern weather forecasting. By safeguarding the accuracy, availability and trustworthiness of observations, it strengthens the global forecasting infrastructure on which weather services, decision-makers and millions of people rely every day.
Further reading
Discover our series exploring how observations underpin weather, environmental and climate services and how ECMWF uses them: