


© ABBPhoto / iStock / Getty Images Plus
Sharp rises in the intensity of global heat stress are exposing more people to hazardous heat, a groundbreaking new study reports.
The results, published today (22 June 2026) in the journal Nature Climate Change, reveal how the frequency, severity, and duration of heat stress have accelerated and intensified across the globe since around 1970, impacting health and livelihoods around the world.
Heat stress is the leading cause of weather-related deaths and involves the build-up of body heat due to exposure to high temperatures, often combined with other factors such as high humidity. Heat can exacerbate underlying cardiovascular, respiratory and mental health conditions, especially affecting, for example, vulnerable people, outdoor workers and urban residents.
New research by scientists at ECMWF provides a first comprehensive global-scale analysis of heat stress with climate change, offering new insights for public health, climate adaptation strategies and policy planning.
Lead author and Senior Scientist at ECMWF, Rebecca Emerton, said: “Our research shows a clear, climate-driven intensification of heat stress across the globe.
"Compared to the 1970s, heat stress is now more severe, more frequent and longer-lasting. As a result, more people worldwide are exposed to hazardous heat, driven not only by population growth but by our changing climate. These findings highlight the need to both limit future warming and integrate heat stress into climate risk assessments, early warning systems and policy and planning to protect human health.”

Changes in feels-like temperatures (UTCI), heat stress days and tropical nights over time. Maps show the difference between the 1970s and the last 10 years (2015–2024), based on decadal averages of: the 10 highest daily maximum UTCI values per year (°C), the 10 highest daily minimum UTCI values per year (°C), the annual number of days with at least very strong heat stress (UTCI ≥ 38°C) and the annual number of tropical nights (minimum temperature ≥ 20°C). Line charts show the global average for each indicator, for each year from 1950 to 2024, with trends per decade since the 1970s shown above each chart. Data: ERA5-HEAT. Source: Emerton et al., 2026
Using the Universal Thermal Climate Index (UTCI), this research provides the first simultaneous global tracking of not only daytime extremes but also nighttime heat and compound daytime-nighttime events.
The paper compares heat stress conditions in our current climate (2015–2024) with those in the 1970s and illustrates how every continent is now affected by more frequent ‘very strong’ and ‘extreme’ heat stress, with the footprint expanding into previously unaffected regions.
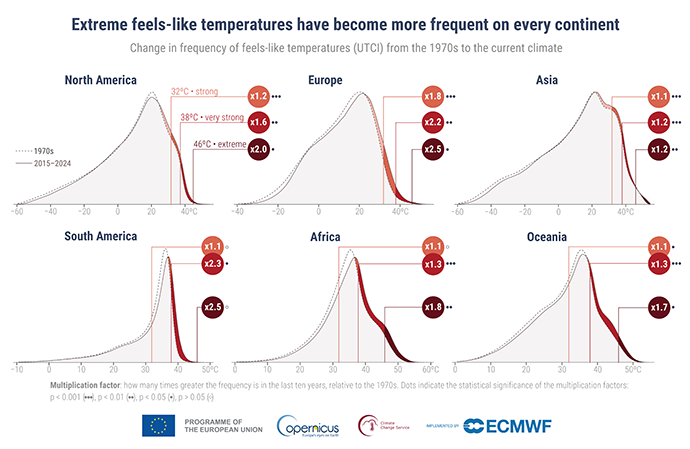
Frequency distribution of feels-like temperatures (UTCI) for each continent, and increase from the 1970s to the last 10 years (2015–2024). Frequency is defined as the total number of occurrences, calculated as the sum across all grid cells and days within two periods: the 1970s and the last 10 years (2015–2024). Thresholds for strong (32°C), very strong (38°C) and extreme (46°C) heat stress are highlighted, together with multiplication factors showing how much more often these thresholds were exceeded in 2015–2024 than in the 1970s. Dots indicate the statistical significance: P < 0.001 (•••), P < 0.01 (••), P < 0.05 (•). An open circle indicates P > 0.05. The shaded areas highlight the shift of the distributions towards more extreme values. Data: ERA5-HEAT. Source: Emerton et al., 2026
Daily maximum UTCI is rising, and heat stress seasons are lengthening, with more frequent, severe, and prolonged compound events. Pronounced trends are observed across the globe, with some of the largest changes seen in Europe, Africa, the Arabian Peninsula and North America, among other regions.
In southern Europe, and parts of northern Africa and the Arabian Peninsula, for example, the maximum UTCI on the ten warmest days of the year is up to 4°C warmer in our current climate than in the 1970s, and in parts of southwestern Europe, up to 5°C warmer.
Elsewhere, increases fall generally between 2–3°C. In Europe, extreme heat stress, while still rare, now occurs 2.5 times more frequently, while subtropical regions – including southern North America, southern Europe, Africa and South America – are now experiencing up to 50 more days per year with at least strong heat stress.
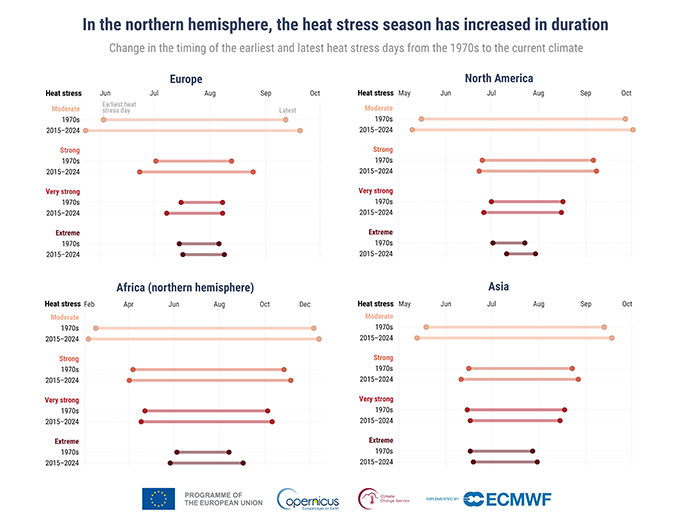
Change in the duration of the heat stress season. For each continent in the northern hemisphere, the average earliest and latest heat stress day of the year, for four heat stress thresholds (moderate (≥ 26°C UTCI), strong (≥ 32°C UTCI), very strong (≥ 38°C UTCI) and extreme (≥ 46°C UTCI) heat stress), in the 1970s and in the last ten years (2015–2024). Due to the year-round presence of the lower categories of heat stress in the tropics and less defined seasonality, the tropics are excluded from this analysis. Data: ERA5-HEAT. Source: Emerton et al., 2026
Understanding heat stress beyond air temperature
Taking the study beyond standard air temperature measurements, UTCI is used to capture the physiological impact of the environment. Expressed in °C, it represents a "feels-like" temperature that accounts for air temperature, humidity, wind, and radiation, while modelling how the human body responds to the environment.
Considering factors beyond temperature is important, as a high humidity and low wind environment, for example, may be more hazardous to health than the same temperature at a lower humidity and with a breeze or cloud cover. As such, UTCI can differ substantially from the measured air temperature.
Claudia Di Napoli, Scientist at ECMWF and co-author of the paper, explains why it is critical to look beyond air temperature: “The Universal Thermal Climate Index (UTCI) can differ substantially from air temperature. During the recent May 2026 heatwave in Europe, for instance, UTCI often reached values 4°C higher than air temperature at their daytime peak. This highlights the importance of considering other factors, such as humidity and radiation.”
Umberto Modigliani, Acting Director of Forecasts at ECMWF, concluded: “This study provides compelling evidence that heat stress is no longer an emerging risk but a defining feature of today’s climate. By capturing how it is experienced by people across both day and night, this research shows a clear intensification that is already affecting societies worldwide. This reinforces the critical role of reliable and trusted weather and climate information in helping communities anticipate, adapt, and protect lives and livelihoods.”
Further information
The research quantifies heat stress trends and population exposure over time, mapping the changing footprint of hazardous heat across the globe.
Using the UTCI, the researchers assessed heat stress globally drawing on ERA5-HEAT reanalysis dataset to examine changes in heat stress from 1950 to 2024, comparing our current climate (2015–2024) directly against the 1970s, the decade that marks the beginning of a clear and sustained global trend in heat stress indicators, to capture the magnitude of the change. Reanalysis datasets combine observational data with state-of-the-art models to ‘fill in gaps’ where observations are scarce or absent, providing globally consistent datasets of past weather and climate.
To link physical trends to societal impacts, UTCI data was combined with global demographic data to quantify population exposure to heat stress and how the proportion of the global population experiencing hazardous heat has evolved.
UTCI models thermal stress for a standardised reference individual but does not account for individual variability, including differences in age, body composition or acclimatisation.
The ERA5 and ERA5-HEAT data used in the study are freely and openly available from the Copernicus Climate Data Store. The data can also be explored interactively using the online application from ECMWF and Copernicus Climate Change Service, Thermal Trace.