
Western Europe experienced its hottest summer on record in 2026, while Europe as a whole had its third warmest summer.
The exceptionally warm season is a reminder of the growing pressures that climate change can place on communities, infrastructure, and natural resources.
Understanding climate risks, however, involves more than knowing how temperatures or rainfall patterns are changing.
For local authorities planning how to adapt, the challenge is to understand what these changes could mean for their region – which areas are most exposed to hazards, which people and assets could be affected, and where action is most urgently needed.
Doing this requires climate information to be combined with local data and knowledge.
Through the European Commission-funded Horizon Europe project VALORADA (Validated Local Risk Actionable Data for Adaptation), we have, with project partners, been exploring how climate data available through the European Commission's Copernicus Climate Change Service (C3S) implemented by ECMWF, can be more readily used alongside local data for these kinds of assessments.
Following the project’s conclusion this summer, we have released two new Jupyter books that demonstrate how C3S data can be used in assessments of drought and extreme precipitation, using datasets available through the Copernicus Climate Data Store (CDS).
The books are designed to help users move from accessing climate information to applying it in reproducible workflows that can be adapted to different regions and needs.
Understanding how regions use climate information
Running from 2023 to 2026, VALORADA, led by Helmholtz-Zentrum hereon GmbH, has brought together 14 European partners, including ECMWF, to strengthen climate adaptation and resilience at regional and local levels.
The VALORADA project contributes to the European Union’s (EU) Mission on Adaptation to Climate Change, supporting the EU's ambition to help 150 regions become climate-resilient by 2030.
The project addressed a practical challenge: although climate information is increasingly accessible, turning it into evidence that supports local decisions can be difficult.
Regional authorities often hold valuable information about their populations, infrastructure and economic activities, but these datasets are typically disconnected from climate observations, projections, and satellite-derived information.
VALORADA aimed to raise awareness of the untapped potential of existing data in supporting regions to adapt to climate change, demonstrating how climate data becomes actionable when combined with the rich and granular information that the local regions already possess.
These demonstrator workflows do not replace nationally validated assessments or locally provided climate services; they show how C3S information can be combined with authoritative national and local data.
Each source contributes a different part of the picture. Climate data can help identify where a climate hazard may occur, while local information about population, land use and infrastructure can show what and who may be exposed.
The project developed a climate risk framework that weaves together three previously isolated data streams: local socio-economic and demographic data, satellite Earth observation datasets, and regional climate observations and projection datasets.
Across the VALORADA consortium, partners co-developed prototypes and data manipulation tools alongside user-centred information on climate resilience. Regions were given customisable workflows and datasets that facilitate decision making tailored to local needs and priorities.
Regions in Bulgaria, Czechia, France, Greece and Italy (Figure 1) tested these approaches and provided feedback, helping the consortium understand how climate data and local information can be combined to support regional risk assessments.
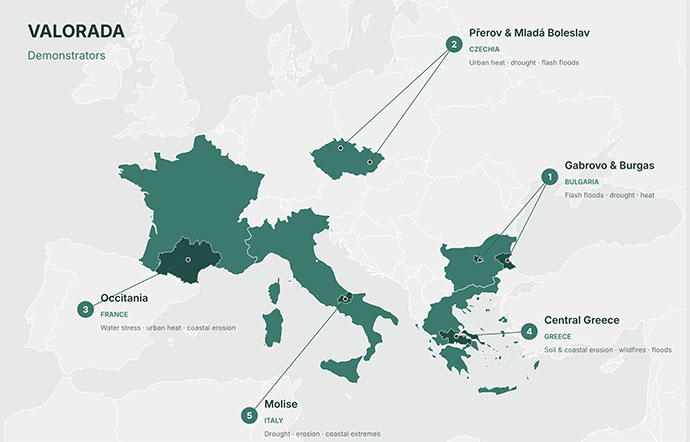
Figure 1: Map of the demonstrator regions involved in VALORADA and the climate challenges addressed in each region. Credit: AI-generated using Claude
The result is a more complete picture of climate risk, helping authorities identify vulnerable infrastructure, understand which populations may be most affected, and assess the potential consequences of inaction.
From one region to many
ECMWF’s contribution focused on translating the project’s findings into practical, reproducible resources that demonstrate how users can access climate data through the CDS and combine it with local datasets to assess drought and extreme precipitation risks.
Rather than producing a bespoke solution for a single region, the project has packaged its methodology into Jupyter notebooks, a widely used format for transparent and reproducible computational workflows.
The methodology can support regions and national partners in developing climate-risk assessments adapted to their geography, priorities and available data. The resources are intended to complement the expertise and services provided by national meteorological and hydrological services and other national authorities.
The two Jupyter books developed by ECMWF and released as part of the Centre’s training resources (linked below) showcase practical assessment approaches that can be adapted to different regions, hazards and sectors. Rather than providing only code examples, they guide users through complete assessment workflows and promote good practices for working with climate data.
Figure 2 illustrates an example from the Molise region in southern Italy, one of the demonstrator regions featured in the extreme precipitation book.
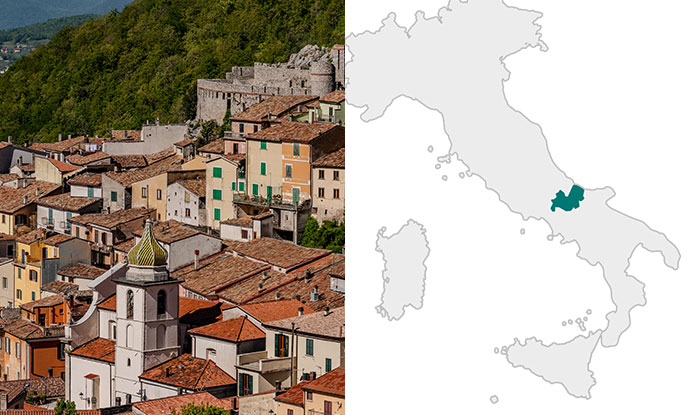
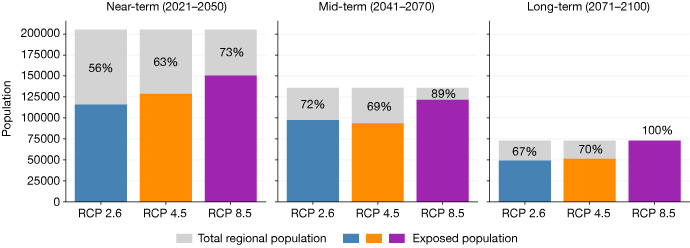
Figure 2: (Top) Town in the region of Molise (left; credit: serfeo/Adobe Stock) and map showing the Molise region in Italy (right; credit: VALORADA). (Bottom) Population in Molise, Italy, exposed to an increase of at least 1.5 times in the intensity of a 20-year extreme precipitation event across near-term (2021–2040), mid-term (2041–2070) and long-term (2071–2100) periods. Coloured bars show the exposed population, grey bars show the total regional population, and percentages indicate the proportion of the population exposed under different representative concentration pathways (RCPs) from low (RCP 2.6) through medium (RCP 4.5) to high (RCP 8.5) scenarios.
The books are also the first ECMWF training resources developed using the Diátaxis framework, which structures content into tutorials, how-to-guides, reference material and explanations. This helps users quickly find the type of information they need. Most tutorials can be run immediately using small sample datasets provided through GitHub, allowing users to explore the methods without downloading large datasets. The books also demonstrate, through short how-to-guides, how climate information can be retrieved directly from the CDS using reproducible, programmatic approaches.
A step towards reproducible climate risk assessments
VALORADA’s main takeaway is that cities and regions already hold much of the data they need for local climate adaptation, but its value goes untapped.
Each administration may not realise a dataset is useful, may overlook opportunities to use existing data, or may lack the capacity to make use of it.
VALORADA’s answer was to combine local socio-economic and land-use data with climate and Earth observation data through co-designed methods. These included Climate Impact Chains for each demonstrator’s priority risks, a Data Valuation Framework, the Resilience Data Catalogue, and processing and visualisation tools.
These Jupyter books reinforce the VALORADA approach and provide an important capacity-building role to enable climate resilience in the demonstrator regions and beyond,
Developing the books also highlighted an important lesson for climate risk assessments: while climate hazard information is increasingly available through open and accessible services such as the CDS, exposure and vulnerability data often remain more fragmented, less standardised and harder to access.
As a result, many parts of a climate risk assessment can now be reproduced through automated, programmatic workflows, while the integration of exposure and vulnerability information frequently still requires substantial manual effort. Improving the accessibility and interoperability of these datasets will be an important step towards fully scalable and reproducible climate risk assessments.