
The summer of 2026 was exceptionally warm across western Europe.
It was the warmest summer on record in the region in terms of average temperature. Much of Europe was also extremely dry.
Embedded within the anomalous season were several record-breaking heatwaves. The first episode began in late May, when many national and local May maximum-temperature records were broken across western Europe.
A second heatwave developed over western Europe in late June before shifting eastward, breaking all-time temperature records in several central and northern European countries.
July remained warm and very dry across much of western and central Europe, contributing to drought conditions, very low flows in major rivers such as the Rhine and Danube, and numerous wildfires. In August, the warm anomalies continued, with further record-breaking temperatures in central Europe.
In this blog, I look at how well we predicted the unusual temperatures during the summer, with a particular focus on forecasts on the sub-seasonal timescale – from around two to six weeks ahead. I first look at the overall seasonal pattern, before focusing on the individual heatwaves.
A persistent warm and dry signal
Figure 1 compares mean temperature anomalies in ERA5 with averages of sub-seasonal forecasts at lead times of 2, 3 and 6 weeks, based on weekly anomalies valid for 4 May to 30 August.
ERA5 shows warm anomalies across much of western and central Europe. The strongest anomaly was found over northern France, where the four-month anomaly reached about 3°C. However, conditions were close to normal over northern and eastern Europe.
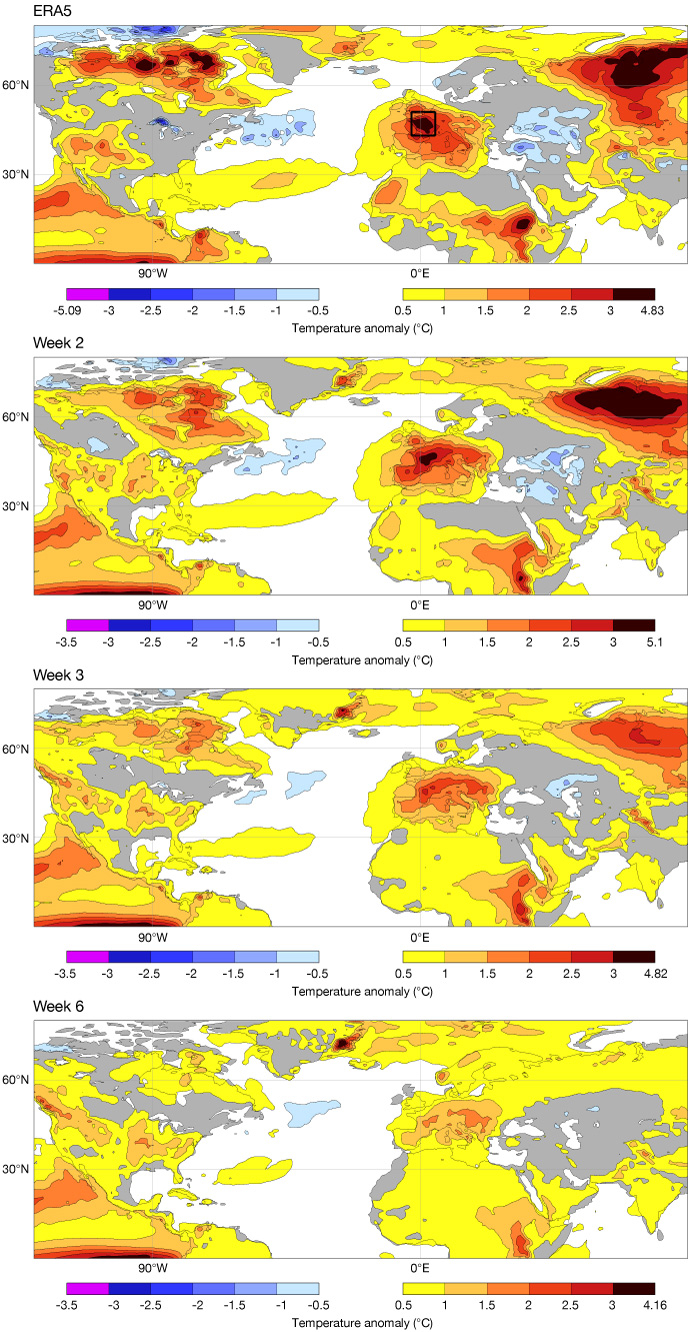
Figure 1: Average temperature anomalies (°C) in ERA5 (top panel) and composites of sub-seasonal forecasts at lead times of 2, 3 and 6 weeks (lower three panels), based on weekly anomalies for 4 May–30 August. The box in the top panel indicates the area over France used for the analysis shown in Figure 3.
The mean of the week-2 and week-3 forecasts captured the broad western European warm signal, although the week-3 forecast incorrectly predicted anomalous warmth over Scandinavia, where observed temperatures were closer to normal.
By week 6, the warm signal covered most of Europe but was stronger over southern and central Europe compared to northern Europe. This pattern resembles the seasonal forecast issued in May for June to August (not shown).
The corresponding precipitation diagnostic (Figure 2) indicated a strong dry anomaly in ERA5 across much of Europe, except in Scandinavia and north-eastern Europe. This pattern was reasonably well predicted at weeks 2 and 3, and even the week-6 mean retained a contrast between dry central Europe and wet western Scandinavia.
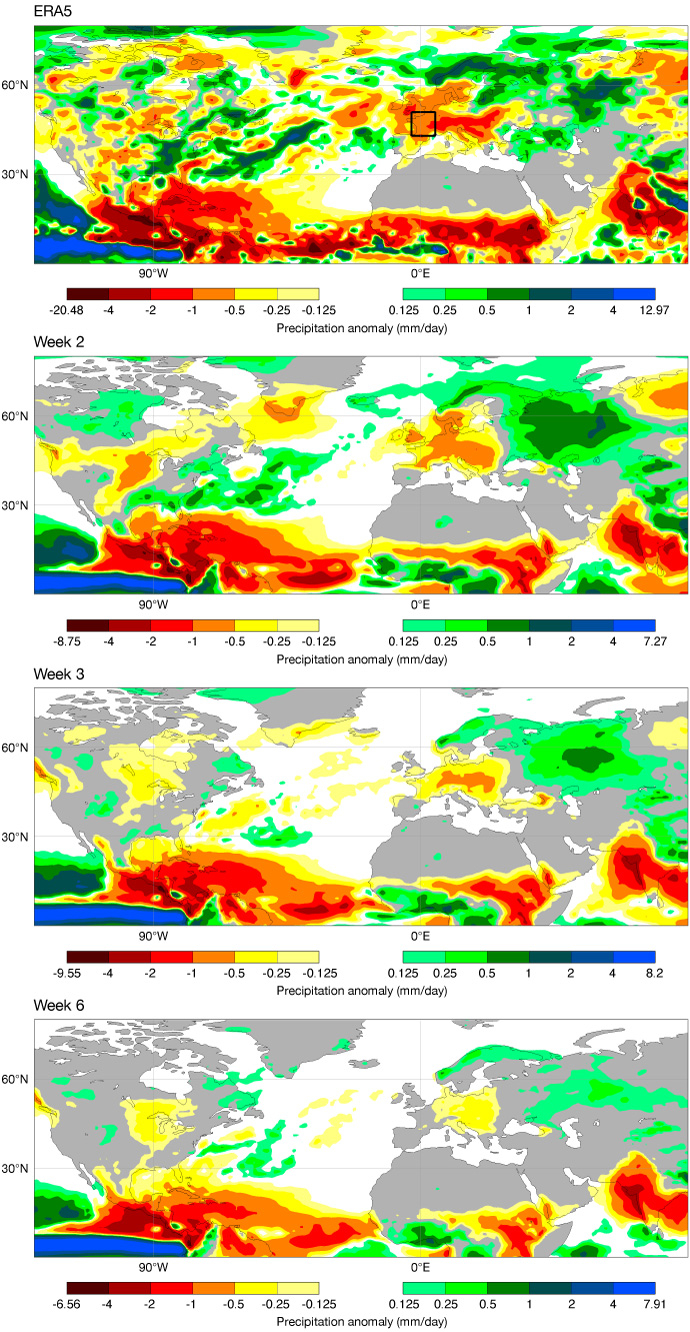
Figure 2: As Figure 1 but for weekly mean precipitation anomaly (mm/day).
As for the atmospheric circulation pattern, represented by anomalies in 500 hPa geopotential height (Z500; not shown), an anticyclonic Z500 anomaly was centred over Great Britain and Ireland. This was well captured in the week-2 forecast, while the week-3 and week-6 forecasts had the anomaly centred over southern (week 3) and central (week 6) Europe. The positions of the anomalies at the longer lead times co-located with the temperature anomalies, suggesting that the Z500 anomalies are related to the thermal expansion of the atmosphere.
These forecasts therefore provided a useful signal that western and central Europe were likely to be warmer and drier than normal. But could we predict the individual heatwaves within the season?
Analysis of four heatwaves
To investigate whether we could predict the heatwaves, I focus on a box covering most of France (see top panel in Figure 1). France experienced the strongest temperature anomaly in Europe over the period, and analysing a smaller region allows us to examine how the forecasts evolved from week to week.
Figure 3 shows weekly temperature anomalies from ERA5 and ensemble-mean sub-seasonal forecasts at different lead times. Although temperatures remained generally above average from mid-June to end of August, four distinct heatwaves can be seen for the weeks starting 25 May, 22 June, 6 July and 10 August.
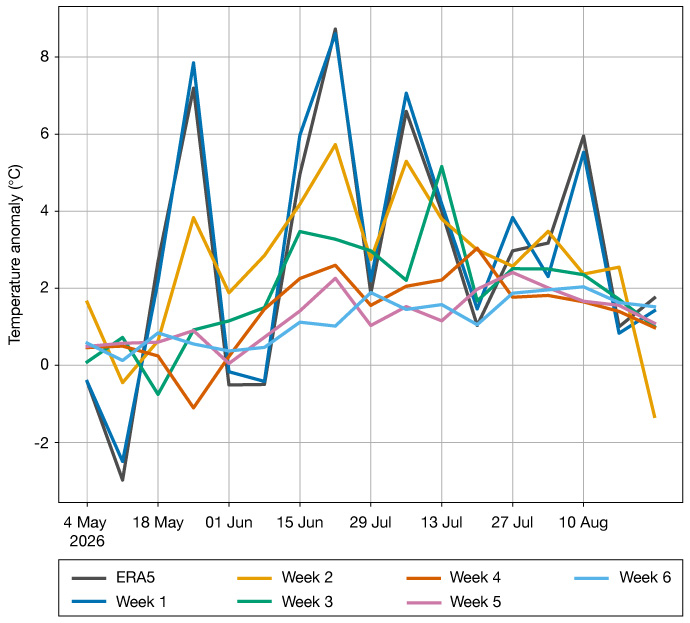
Figure 3: Weekly temperature anomalies from ERA5 and ensemble-mean sub-seasonal forecasts at different lead times, averaged over a box covering most of France (see Figure 1, top panel).
The week-1 forecasts followed the ERA5 anomalies well, as expected from the short- and medium-range predictability. The week-2 forecasts captured the timing of the first three warm peaks but missed the early-May cold anomaly, the cold break between the May and June heatwaves, and the August event.
At longer lead times, the forecasts became warmer as the season progressed, but they provided little guidance on the intra-seasonal variability. This increasing warm signal may be a consequence of increasingly dry initial conditions, but this requires further experiments to confirm.
A closer look at the June heatwave
The heatwave across Europe in the week beginning on 22 June was the strongest of the four in ERA5. Figure 4 shows the ensemble mean anomalies for this event in forecasts issued from one to four weeks beforehand.
Even at three weeks ahead, the forecast gave a useful indication of where the warmest temperatures would occur. The anomalies were weaker than in the week-1 forecast, but the regional extent of the heatwave was captured well. For example, the 3° contour in the week-3 forecast is similar to the 6° contour in the week-1 forecast.
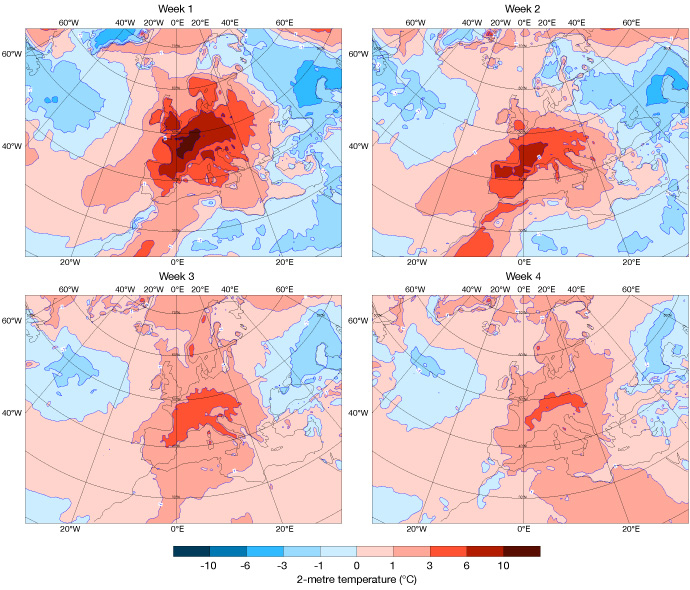
Figure 4: Weekly ensemble-mean 2-metre temperature anomalies for the week starting 22 June, in forecasts from 22 June (week-1), 15 June (week-2), 8 June (week-3) and 1 June (week-4).
The week-4 forecast was less specific, predicting warm conditions for the whole of Europe, and missed the cold anomaly over north-eastern Europe. However, it still placed the warmest temperatures north and west of the Alps, agreeing well with the anomalies in the week-1 forecast.
ECMWF produces sub-seasonal forecasts every day, allowing us to track how the forecast signal for an event evolves as it approaches. A summary of all predictions leading up to the heatwave beginning on 22 June is shown in Figure 5. To put the forecasts into context, Figure 5 also includes the model climate for two different forecast lengths, which represents the range of temperatures that the forecasting system would normally expect at this time of year.
The forecasts with a long lead time (i.e. 4 weeks before the event) had a warm anomaly of around 2°C, as expected from Figure 4. For long lead times, the error in the climatology (model drift) needs to be taken into consideration.
In this case the model climate mean is a few tenths of a degree colder for week 4 (green) compared to week 2 (cyan). Between 8 and 17 June, the ensemble strengthened the signal, but not in a smooth or consistent way.
For example, the forecast from 11 June was somewhat colder than forecasts issued the days before and after. Between 17 and 19 June, the forecast distribution quickly converged to the warm extreme in the analysis.
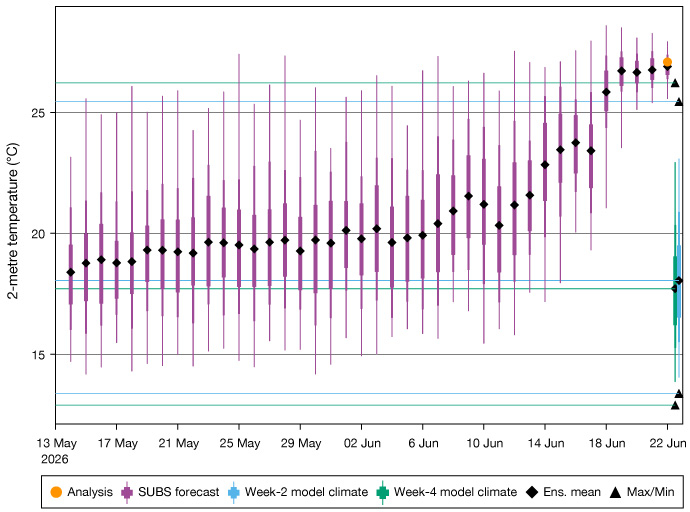
Figure 5: Weekly mean 2-metre temperature over France (boxed region in Figure 1) for the week starting 22 June. Box-and-whisker symbol for each forecast with ensemble mean as black diamonds, with the initialisation date on the x-axis. The mean temperature from the analysis is shown as an orange dot. Model climate distribution based on week-2 (light blue box-and-whisker) and week-4 (green box-and-whisker).
Learnings from summer 2026
Looking back at an exceptional season like this is an important part of understanding forecast performance. By examining how the forecasts evolved ahead of the heatwaves, we can identify where they provided useful information, where they struggled, and what factors may have influenced their skill.
Looking across the whole summer, there was a general warm signal in the longer-range forecasts (week 4–6). However, capturing the intra-seasonal variability seems to still be a medium-range predictability problem.
The individual heatwaves emerged much more clearly as they came within the medium-range forecast window. This raises many aspects to explore regarding, for example, the skill of the predictions, such as the differences in predictability between the heatwaves, the role of soil moisture, and the skill in machine-learning-based forecasts, among others.