Datasets

Interval/period: N/A
Interval/period: N/A
Interval/period: N/A
Interval/period: N/A

Ensemble (ENS) of forecasts providing an estimate of the reliability of a single forecast.
ENS offers "High Frequency products" until step 144:
4 daily runs: 00, 06, 12 and 18 UTC hourly until step 90 3-hourly from 93 to 144Most Post-processed Products are not available at 06/18 runs or in hourly steps. An exception are Tropical Cycle tracks (set III-viii) which is available for all daily runs: 00, 06, 12 and 18 UTC.
Interval/period: N/A
Interval/period: N/A
Interval/period: N/A
Interval/period: N/A
Interval/period: N/A
Interval/period: N/A
Interval/period: N/A
Interval/period: N/A
Interval/period: N/A
Interval/period: N/A

4-month long 101-ensemble member seasonal attribution experiment (I20_BC98) initialised on 01-November-1997 using the atmosphere-only version of SEAS5 (see Johnson et al., 2019) forced with daily ERA5 SST as in the reference experiment (R98) but with daily SST over the tropical Indian Ocean swapped with that from 2019/20.
Examples
Interval/period: N/A
4-month long 101-ensemble member seasonal attribution experiment (I20_BC16) initialised on 01-November-2015 using the atmosphere-only version of SEAS5 (see Johnson et al., 2019) forced with daily ERA5 SST as in the reference experiment (R16) but with daily SST over the tropical Indian Ocean swapped with that from 2019/20.
Examples
Interval/period: N/A
4-month long 101-ensemble member seasonal attribution experiment (I98_BC20) initialised on 01-November-2019 using the atmosphere-only version of SEAS5 (see Johnson et al., 2019) forced with daily ERA5 SST as in the reference experiment (R20) but with daily SST over the tropical Indian Ocean swapped with that from 2019/20.
Examples
Interval/period: N/A
4-month long 101-ensemble member seasonal attribution experiment (I16_BC20) initialised on 01-November-2019 using the atmosphere-only version of SEAS5 (see Johnson et al., 2019) forced with daily ERA5 SST as in the reference experiment (R20) but with daily SST over the tropical Indian Ocean swapped with that from 2019/20.
Examples
Interval/period: N/A
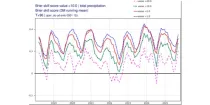
These diagrams show Brier Skill Scores (BSS) for two parameters at several forecast lead-times ...
Interval/period: N/A
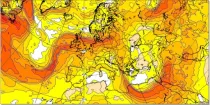
Bulk Wind Shear charts show the scalar value of the shear between the winds at the two pressure levels selected. Shear can be useful in assessing the strength of a front or...
Interval/period: N/A
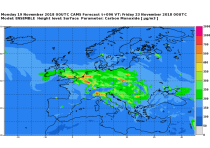
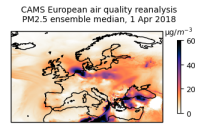
CAMS produces specific daily air quality analyses and forecasts for the European
domain at significantly higher spatial resolution (0.1 degrees, approx. 10km)
than is available from the global analyses and forecasts. The production is
based on an ensemble of eleven air quality forecasting systems across Europe. A
median ensemble is calculated from individual outputs, since ensemble products
Interval/period: Wed, 05/03/2023 - Fri, 05/08/2026

This dataset provides daily air quality analyses and forecasts for Europe.
Interval/period: N/A
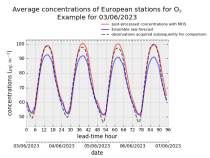
stations after optimisation using a statistical post-processing method called
Model Output Statistics (MOS). The unoptimised "raw" forecasts are also
provided in the same format.
The MOS method uses machine learning with predictive variables including
background air quality observation datasets, ECMWF meteorological forecasts and
the "raw" CAMS European air quality ensemble median forecast. The result is
Interval/period: Wed, 01/17/2024 - Fri, 05/08/2026
Interval/period: Tue, 01/01/2013 - Tue, 12/31/2024

This dataset provides annual air quality reanalyses for Europe based on both unvalidated (interim) and validated observations.
Interval/period: N/A