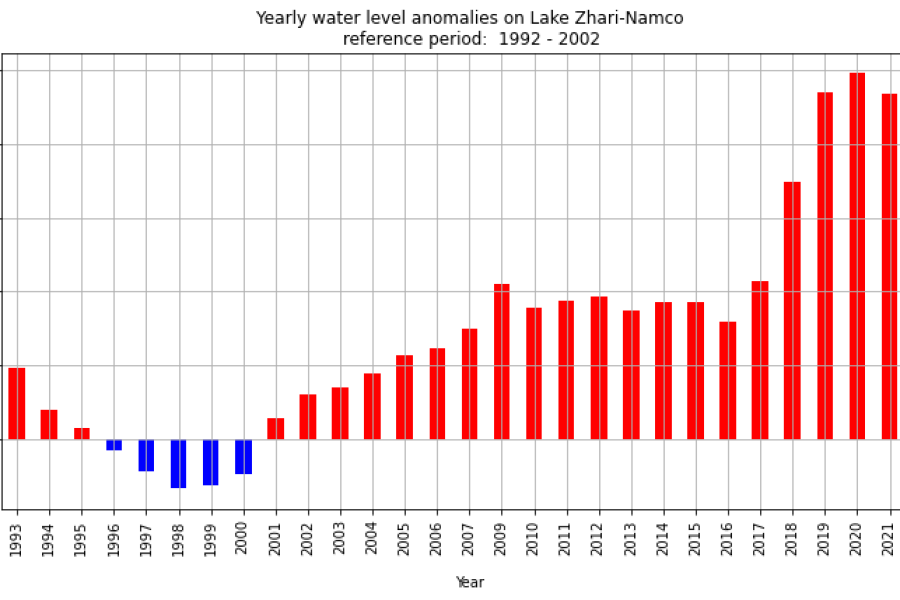
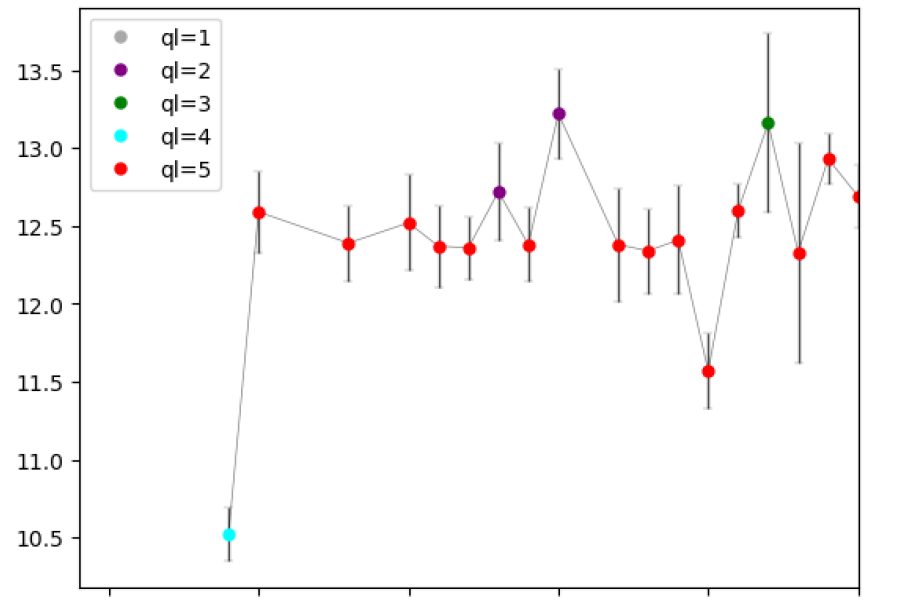
How to access the water level data for a specified lake and how to visualise its timeseries and yearly water level anomalies
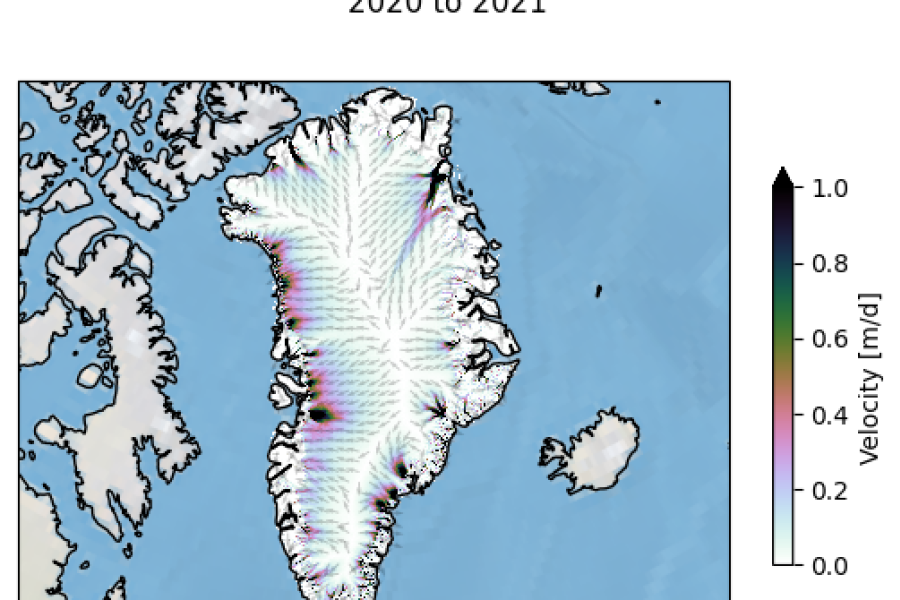
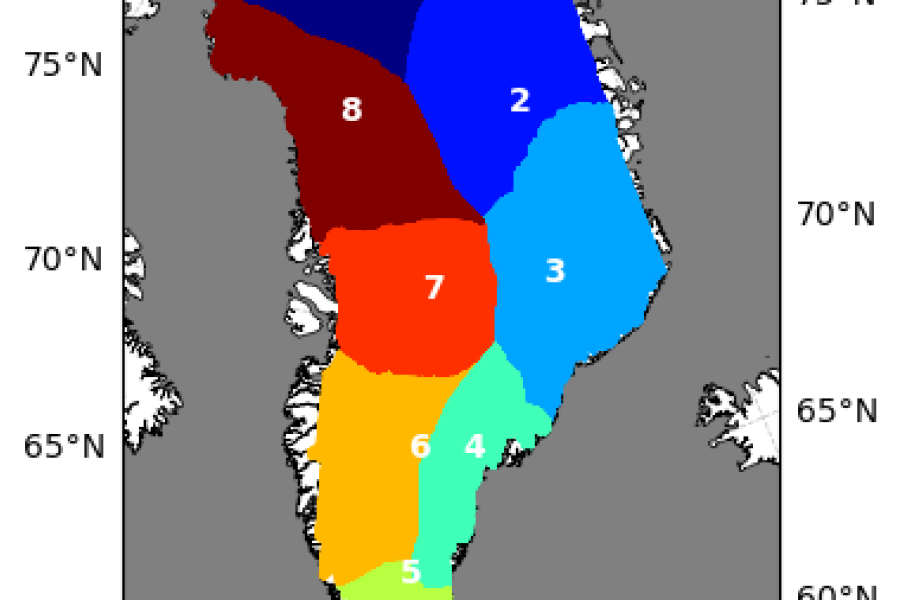
Plotting velocity maps and flow vectors of the Greenland Ice Sheet and its major outlet glaciers, using ice velocity data
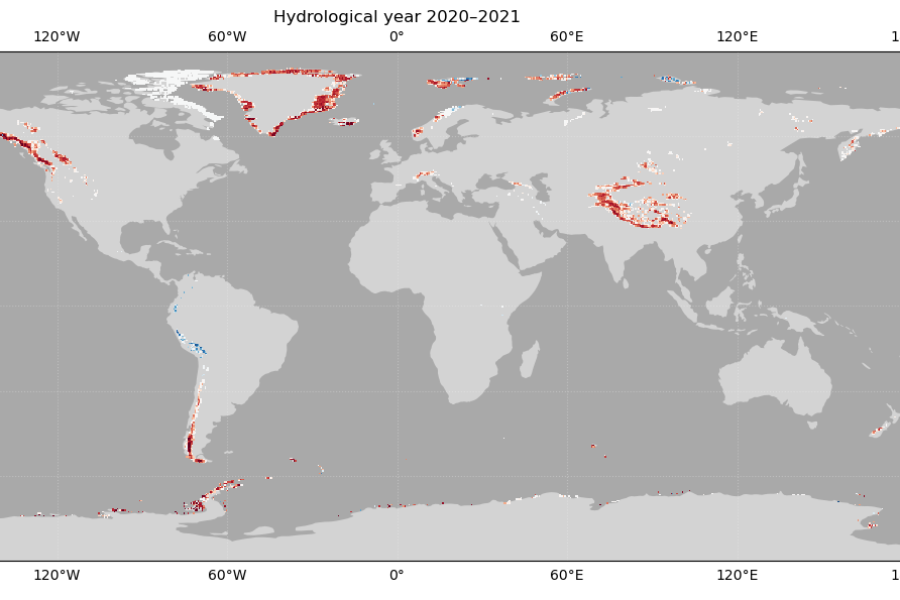
Glacier mass change dataset from the CDS: inspection, plotting and animation of the time series of the annual gridded files
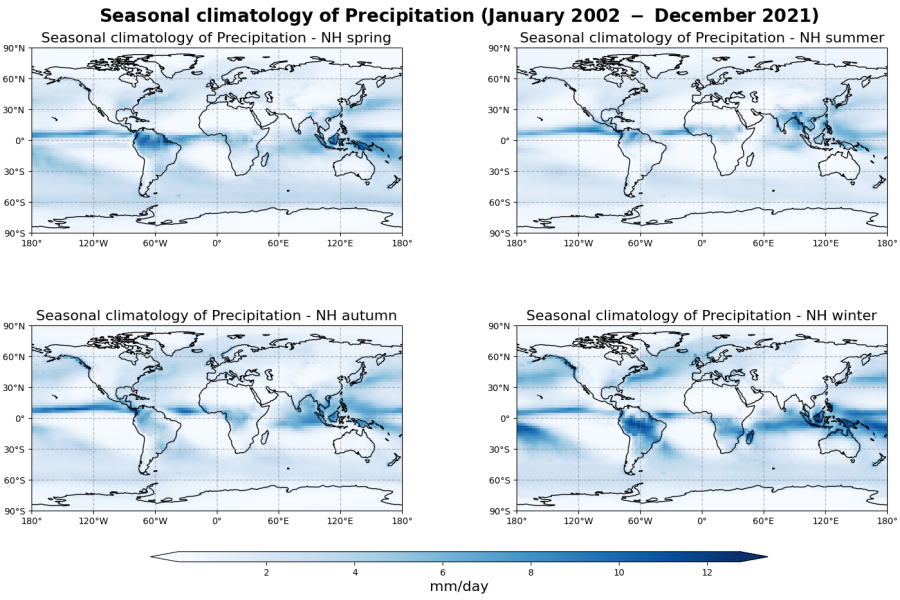
Using GIRAFE data record for climate studies. Two use cases: analysis of time averaged and seasonal data; trend analysis
LSWT from satellite radiometers: download and extraction; visualization of timeseries and location of the lake centre; quality and uncertainty
Gravimetric Mass Balance data for selected regions. Download, calculation and display average change rates over time.
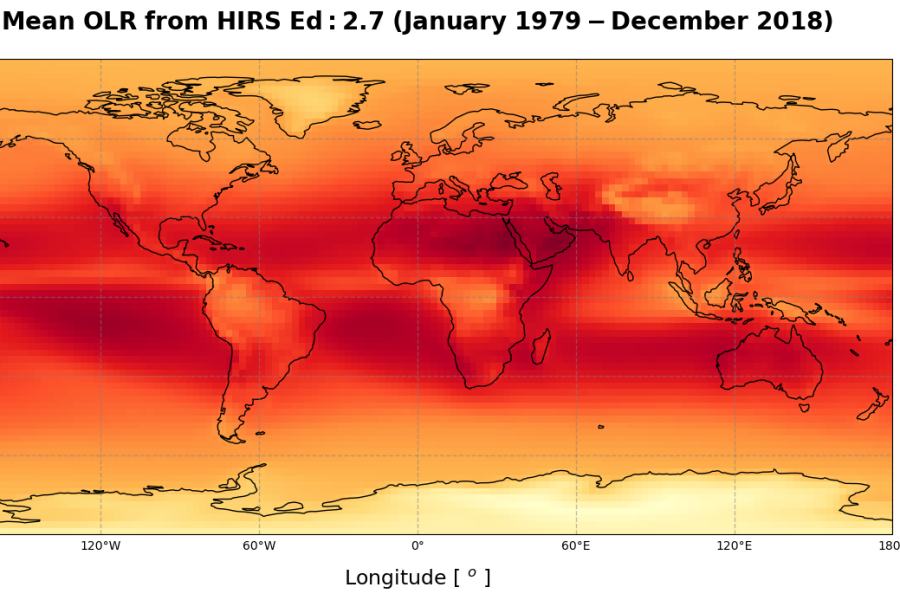
Introduction to the ECV Earth Radiation Budget, Outgoing Longwave Radiation (OLR) and three use cases
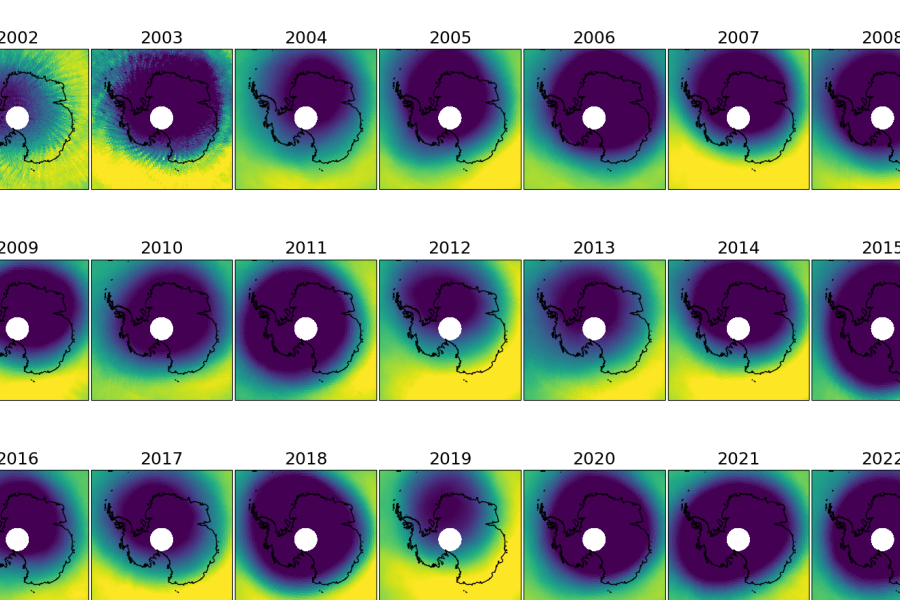
Spatial and temporal ozone distribution of the total ozone columns. Retrieval of the data and analysis.
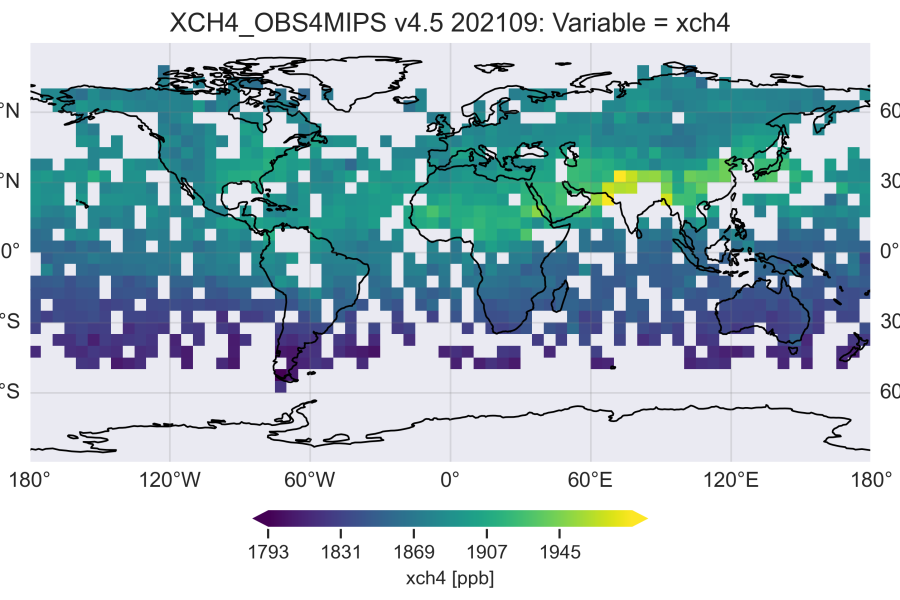
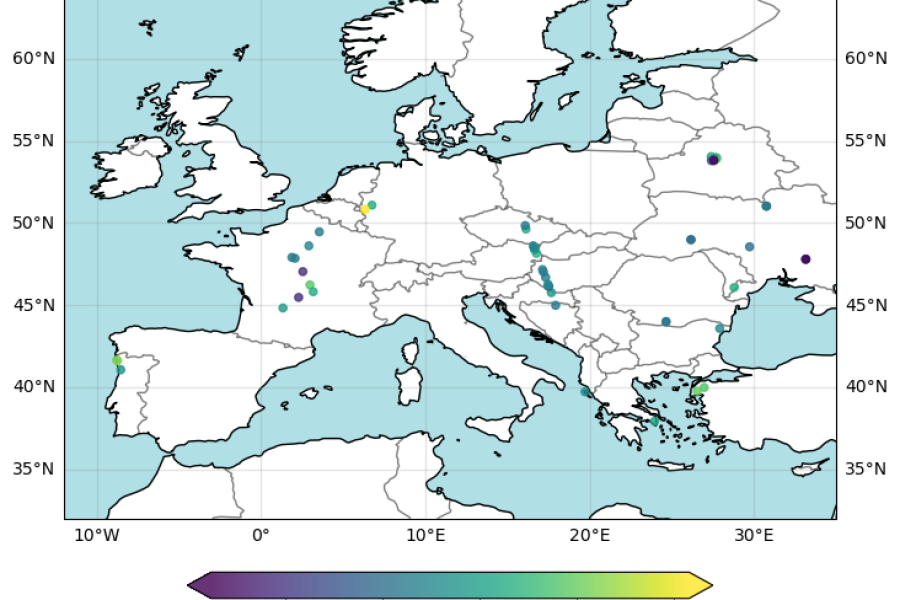
How to access, read and use Greenhouse Gas atmospheric carbon dioxide and methane data: temporal and spatial variation.
Access and use of satellite-derived Greenhouse Gas (GHG) atmospheric carbon dioxide (CO2) Level 2 data product.