Datasets
These daily and monthly data are pre-calculated and have the following types depending on the variables: daily and monthly averages, extremes and totals.
Interval/period: Sat, 09/01/1990 - Sat, 02/28/2026

This chart shows probability information regarding lightning flash density derived from the ...
Interval/period: N/A

This chart shows probability information regarding CAPE shear derived from the ECMWF ensemble ...
Interval/period: N/A

This chart shows probability information regarding MUCAPE derived from the ECMWF ensemble (ENS) ...
Interval/period: N/A
Interval/period: Wed, 01/01/1975 - Sun, 07/05/2026
Interval/period: Wed, 01/01/2003 - Sat, 12/31/2022

These charts show areas where anomalous CAPE are likely to occur.
Interval/period: N/A

These charts show areas where anomalous CAPE Shear are likely to occur.
Interval/period: N/A

These charts show indices which indicate the susceptibility of the troposphere to support free convection. Typical values of the different indices depend on location and...
Interval/period: N/A

This diagram shows time evolution of a Madden-Julian Oscillation (MJO) index. ...
Interval/period: N/A
Interval/period: Wed, 01/01/1992 - Sun, 07/05/2026
Interval/period: Sun, 10/01/2017 - Sun, 07/05/2026
Interval/period: Tue, 10/01/1985 - Wed, 12/31/2025
Interval/period: Sun, 09/01/1985 - Wed, 12/31/2025

MUCAPE (Most Unstable Convective Available Potential Energy) is an indicator of atmospheric instability (the susceptibility of the troposphere to support free convection) and...
Interval/period: N/A
Interval/period: Tue, 01/02/1979 - Sun, 07/05/2026
Interval/period: Thu, 01/01/1998 - Fri, 12/31/2010
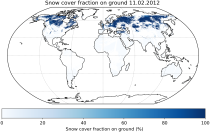
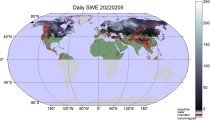
It provides Level 3 collated (L3C) processed products, namely global daily single-sensor Snow cover fraction viewable (SCFV) and Snow cover fraction on ground (SCFG) products, both of which are based on optical satellite data.
Interval/period: Fri, 01/01/1982 - Tue, 09/30/2025