Datasets
Divergence of horizontal air flow or winds is a measure of the spreading out of air at a particular point. Divergence is +ve where air spreads out; –ve where air converges...
Interval/period: N/A
Interval/period: Sun, 01/01/1950 - Thu, 12/31/2099
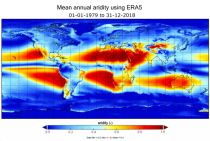
Interval/period: Mon, 01/01/1979 - Mon, 12/31/2018
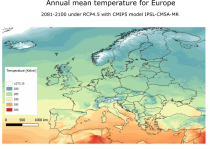
Interval/period: Sun, 01/01/1950 - Thu, 12/31/2099
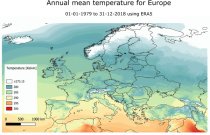
Interval/period: Mon, 01/01/1979 - Mon, 12/31/2018
These charts represent the height of the air temperature 0°C isotherm or the Wet bulb temperature 0°C isotherm...
Interval/period: N/A

The ECMWF seasonal forecasts (SEAS5) are produced every month with a 51-member ensemble at a ...
Interval/period: N/A

This chart provides information on the verification of forecasts of the number of tropical ...
Interval/period: N/A
Interval/period: Sun, 02/01/1981 - Wed, 04/01/2026
Specific humidity gives an indication of the amount of moisture within a sample of air (in g of water vapour within a kg of air, g kg⁻¹). The chart shows the specific humidity at 1000 hPa and 925 hPa levels and...
Interval/period: N/A