
Datasets
Note: This Generation 1 Collection has been superseded by Generation 2 Simulation-level Collections
Interval/period: N/A
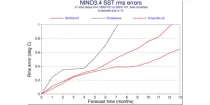
This chart provides a range of skill scores relating to forecasts of the evolution of the sea ...
Interval/period: N/A
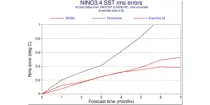
This chart provides a range of skill scores relating to forecasts of the evolution of the sea ...
Interval/period: N/A
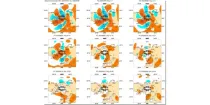
**Note:** In **June 2023** ECMWF implemented a **major upgrade ...**
Interval/period: N/A
GraphCast (Google DeepMind): a deep learning-based system developed by Google DeepMind.It is initialised with ECMWF analysis. GraphCast operates at 0.25° resolution.
Interval/period: N/A
GraphCast (Google DeepMind): a deep learning-based system developed by Google DeepMind.It is initialised with ECMWF analysis. GraphCast operates at 0.25° resolution.
Interval/period: N/A
Pangu-Weather: a deep learning-based system developed by Huawei. It is initialised with ECMWF analysis. Pangu-Weather operates at 0.25° resolution.
Interval/period: N/A
Pangu-Weather: a deep learning-based system developed by Huawei. It is initialised with ECMWF analysis. Pangu-Weather operates at 0.25° resolution.
Interval/period: N/A
Pangu-Weather: a deep learning-based system developed by Huawei. It is initialised with ECMWF analysis. Pangu-Weather operates at 0.25° resolution.
Interval/period: N/A
The nextGEMS data is aligned with the Climate Change Adaptation Digital Twin. The DestinE Digital Twin for Climate Change Adaptation (Climate DT) supports adaptation activities by providing innovative climate information on multi-decadal timescales, globally, at scales at which many impacts of climate change are observed.
Interval/period: N/A
The nextGEMS data is aligned with the Climate Change Adaptation Digital Twin. The DestinE Digital Twin for Climate Change Adaptation (Climate DT) supports adaptation activities by providing innovative climate information on multi-decadal timescales, globally, at scales at which many impacts of climate change are observed.
Interval/period: N/A
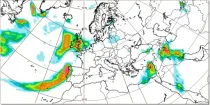
This chart shows probability information regarding point precipitation, as derived from the ...
Interval/period: N/A
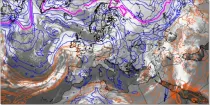
850 hPa wet-bulb potential temperature is commonly used to identify air masses and a strong gradient of wet bulb potential temperature is indicative of fronts between two different air masses...
Interval/period: N/A

The simulated water vapour images generally focus on the upper troposphere. These charts can often indicate dynamical forcing mechanisms (responsible for cyclogenesis) or convective development (related to potential instability)...
Interval/period: N/A
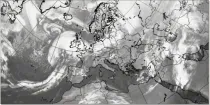
These products display cloud-related fields from the model in a format that is very familiar to forecasters and that they are used to interpreting. They can easily be compared to actual satellite imagery...
Interval/period: N/A
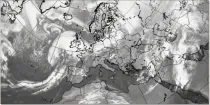
The simulated water vapour images generally focus on the upper troposphere. These charts can often indicate dynamical forcing mechanisms (responsible for cyclogenesis) or convective development (related to potential instability)...
Interval/period: N/A
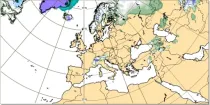
Snow depth is computed using two model parameters - these represent the liquid water equivalent of snow lying on the ground, and the average density of that snow layer...
Interval/period: N/A
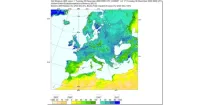
Soil moisture handling in the model is complex, and could be highlighted in many ways. Here a 'relativistic' approach is used for display, showing not absolute values, but instead...
Interval/period: N/A
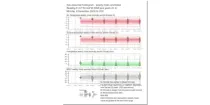
This chart shows the 7-day mean anomalies of four forecast parameters for the Sub-seasonal range ...
Interval/period: N/A
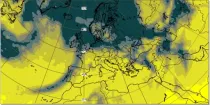
Sunshine for any point is assessed using the model representation of cloud layers to decide how much direct solar (shortwave) radiation reaches the Earth's surface...
Interval/period: N/A
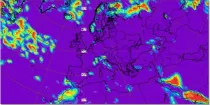
This chart shows probabilities for the 7-day mean anomalies of surface temperature to be in ...
Interval/period: N/A
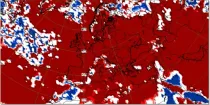
This chart shows probabilities that 7-day mean surface temperatures (from the 101 forecast ...
Interval/period: N/A
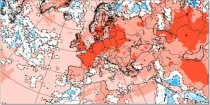
This chart shows 7-day mean anomalies of surface temperature from the ECMWF Sub-seasonal range ...
Interval/period: N/A
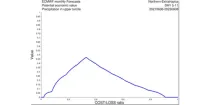
**Note:** In **June 2023** ECMWF implemented a **major upgrade ...**
Interval/period: N/A
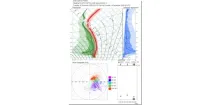
The Vertical Profiles display the vertical structure of the forecast model atmosphere in a familiar user friendly way. The vertical structure of temperatures (red) dewpoints (green) and dewpoint depressions (blue) from each ENS member ...
Interval/period: N/A