Datasets

Cloud base height is derived by upwardly searching the structure of the model atmosphere to find the altitude where the cloud fraction becomes >1% and...
Interval/period: N/A
This chart shows the probability that the temperature at 2 m above the earth’s surface is below 0°C and the total of convective and broad scale precipitation ...
Interval/period: N/A
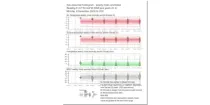
This chart shows the probability that both the wind at 10 m above the earth's surface is ...
Interval/period: N/A
This chart shows the probability that both the wind at 10 m above the earth's surface is ...
Interval/period: N/A

This chart shows the probability that both the wind at 10 m above the earth's surface is ...
Interval/period: N/A
Sunshine for any point is assessed using the model representation of cloud layers to decide how much direct solar (shortwave) radiation reaches the Earth's surface...
Interval/period: N/A
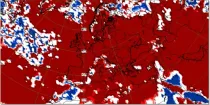
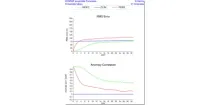
This chart shows probabilities for the 7-day mean anomalies of surface temperature to be in ...
Interval/period: N/A
This chart shows probabilities that 7-day mean surface temperatures (from the 101 forecast ...
Interval/period: N/A
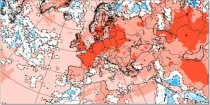
This chart shows 7-day mean anomalies of surface temperature from the ECMWF Sub-seasonal range ...
Interval/period: N/A
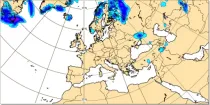
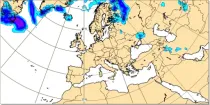
Total accumulated rainfall charts identify areas at greater risk of significant rainfall (or rain equivalent e.g.snowfall) but give no information regarding whether this occurs over a short or prolonged time period...
Interval/period: N/A

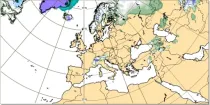
This display helps with the recognition of clouds of different layers, even when they overlap. Brighter colouring represents greater cloud cover. Cloud-free areas appear white while areas of full cloud cover at all levels appear dark grey (e.g. active fronts)...
Interval/period: N/A
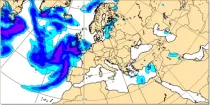
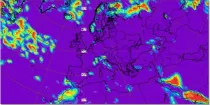
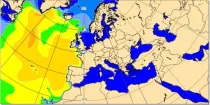
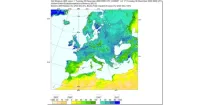
The charts show the forecast value of the vertically integrated total column water (vapour + cloud water + cloud ice but with no precipitation included) in units of kg m⁻²...
Interval/period: N/A
**Note:** In **June 2023** ECMWF implemented a **major upgrade ...**
Interval/period: N/A
Where precipitation is forecast, a type of precipitation can be assigned according to the temperature structure of the model atmosphere that includes the layers through which the model precipitation falls...
Interval/period: N/A
**Note:** In **June 2023** ECMWF implemented a **major upgrade ...**
Interval/period: N/A
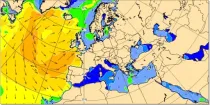
At any location over the oceans, there is a spectrum of waves which describes how much wave energy is present for given wave frequencies and direction of propagation...
Interval/period: N/A
Significant wave height can be shown to correspond to the average wave height of the top one-third highest waves. The wave period of windsea is generally <10s,...
Interval/period: N/A
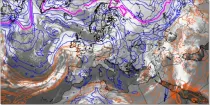
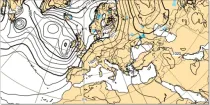
850 hPa wet-bulb potential temperature is commonly used to identify air masses and a strong gradient of wet bulb potential temperature is indicative of fronts between two different air masses...
Interval/period: N/A

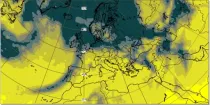
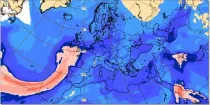
The simulated water vapour images generally focus on the upper troposphere. These charts can often indicate dynamical forcing mechanisms (responsible for cyclogenesis) or convective development (related to potential instability)...
Interval/period: N/A
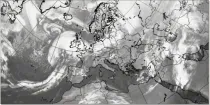
These products display cloud-related fields from the model in a format that is very familiar to forecasters and that they are used to interpreting. They can easily be compared to actual satellite imagery...
Interval/period: N/A

The simulated water vapour images generally focus on the upper troposphere. These charts can often indicate dynamical forcing mechanisms (responsible for cyclogenesis) or convective development (related to potential instability)...
Interval/period: N/A
Snow depth is computed using two model parameters - these represent the liquid water equivalent of snow lying on the ground, and the average density of that snow layer...
Interval/period: N/A
Soil moisture handling in the model is complex, and could be highlighted in many ways. Here a 'relativistic' approach is used for display, showing not absolute values, but instead...
Interval/period: N/A
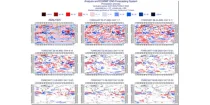
This chart shows the 7-day mean anomalies of four forecast parameters for the Sub-seasonal range ...
Interval/period: N/A