Datasets
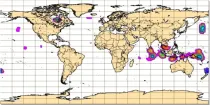
This chart shows the potential for tropical cyclone activity at different time ranges during the ...
Interval/period: N/A

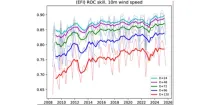
This diagram shows the variation of Relative Operating Characteristics (ROC) scores with various ...
Interval/period: N/A
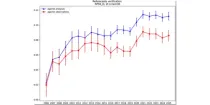
This diagram gives a measure of the effectiveness of the model. The drop-down menu can ...
Interval/period: N/A
This diagram gives a measure of the effectiveness of the model. ...
Interval/period: N/A
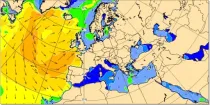
At any location over the oceans, there is a spectrum of waves which describes how much wave energy is present for given wave frequencies and direction of propagation...
Interval/period: N/A
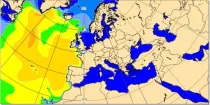
At any location over the oceans, there is a spectrum of waves which describes how much wave energy is present for given wave frequencies and direction of propagation...
Interval/period: N/A
Significant wave height can be shown to correspond to the average wave height of the top one-third highest waves. The wave period of windsea is generally <10s,...
Interval/period: N/A

At any location over the oceans, there is a spectrum of waves which describes how much wave energy is present for given wave frequencies and direction of propagation...
Interval/period: N/A

Interval/period: N/A
Interval/period: N/A
Interval/period: N/A
Interval/period: N/A
Interval/period: N/A
Interval/period: N/A
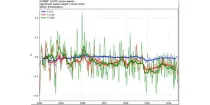
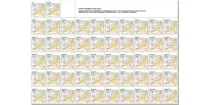
These diagrams show verification scores for significant wave height and 10 m wind for three ...
Interval/period: N/A
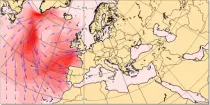
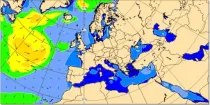
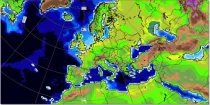
These charts show the the wave energy flux (in kW m⁻¹) calculated as the integral, over all forecast wave frequencies and wave directions, of the product of the wave group speed and the two-dimensional energy wave spectrum...
Interval/period: N/A
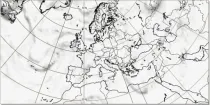
The height of topography above mean sea level and the depth of the sea for each model grid box ...
Interval/period: N/A
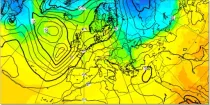
These charts show MSLP and 850hPa forecasts for the Ensemble Control Forecast, and 50 ENS ...
Interval/period: N/A
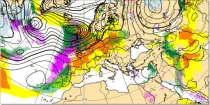
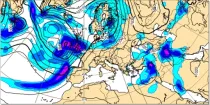
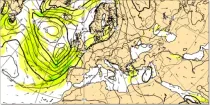
Potential vorticity (PV) helps description and understanding of dynamic processes in the atmosphere by giving an indication of ascending or descending air flows and the development or weakening of ...
Interval/period: N/A

MUCAPE (Most Unstable Convective Available Potential Energy) is an indicator of atmospheric instability (the susceptibility of the troposphere to support free convection) and...
Interval/period: N/A
These charts aim to point towards areas where anomalous weather is likely to occur. ...
Interval/period: N/A
GraphCast (Google DeepMind): a deep learning-based system developed by Google DeepMind.It is initialised with ECMWF analysis. GraphCast operates at 0.25° resolution.
Interval/period: N/A
GraphCast (Google DeepMind): a deep learning-based system developed by Google DeepMind.It is initialised with ECMWF analysis. GraphCast operates at 0.25° resolution.
Interval/period: N/A
GraphCast (Google DeepMind): a deep learning-based system developed by Google DeepMind.It is initialised with ECMWF analysis. GraphCast operates at 0.25° resolution.
Interval/period: N/A
GraphCast (Google DeepMind): a deep learning-based system developed by Google DeepMind.It is initialised with ECMWF analysis. GraphCast operates at 0.25° resolution.
Interval/period: N/A