Datasets

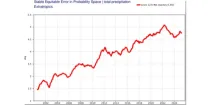
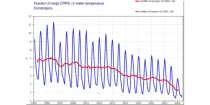
This diagram gives a measure of the effectiveness of the model by showing how far ahead in the ...
Interval/period: N/A
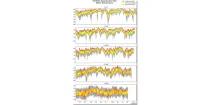
This diagram gives a measure of the effectiveness of the model by showing when the 1-SEEPS of ...
Interval/period: N/A
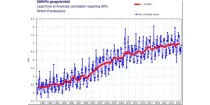
This diagram gives a measure of the effectiveness of the model by showing when the ACC of 500 ...
Interval/period: N/A
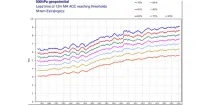
This diagram gives a measure of the effectiveness of the model by showing when the ACC of ...
Interval/period: N/A
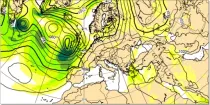
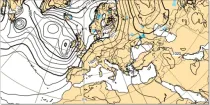
This diagram gives a measure of the effectiveness of the model in forecasting 500 hPa heights at ...
Interval/period: N/A

This diagram gives a measure of the effectiveness of the model by showing when the ACC of 500 ...
Interval/period: N/A
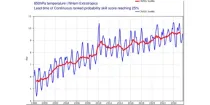
This diagram gives a measure of the effectiveness of the model by showing how far ahead in the ...
Interval/period: N/A

This diagram gives a measure of the effectiveness of the model by showing when the 1-SEEPS of ...
Interval/period: N/A
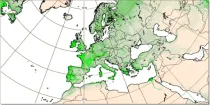
The leaf area index determines the degree of evapotranspiration. The index varies in a climatological way in the model, month by month (and so will not change in a different way if there is anomalous weather)...
Interval/period: N/A
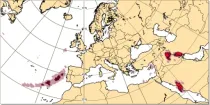
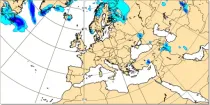
Lightning flash densities are diagnosed from forecast values of hydrometeor content, CAPE (convective available potential energy), and cloud base height that has been output by the convection scheme...
Interval/period: N/A
Maximum Wind gusts at 10 m above the earth's surface during the 6 hour period previous to the selected validity time are shown using colour shading. 10 m wind gusts are a post-processed product...
Interval/period: N/A
The diagram shows mean errors in position and intensity of tropical cyclones for HRES and ENS. ...
Interval/period: N/A
This diagram gives a measure of the effectiveness of the model. ...
Interval/period: N/A

This diagram gives a measure of the effectiveness of the model. ...
Interval/period: N/A
Where precipitation is forecast, a type of precipitation can be assigned according to the temperature structure of the model atmosphere that includes the layers through which the model precipitation falls...
Interval/period: N/A
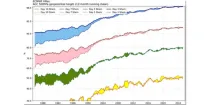
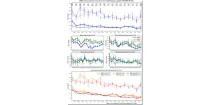
These diagrams compare scores of ensemble control (red) and ensemble members (central 50% of ...
Interval/period: N/A
Total accumulated rainfall charts identify areas at greater risk of significant rainfall (or rain equivalent e.g.snowfall) but give no information regarding whether this occurs over a short or prolonged time period...
Interval/period: N/A

This display helps with the recognition of clouds of different layers, even when they overlap. Brighter colouring represents greater cloud cover. Cloud-free areas appear white while areas of full cloud cover at all levels appear dark grey (e.g. active fronts)...
Interval/period: N/A
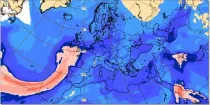
The charts show the forecast value of the vertically integrated total column water (vapour + cloud water + cloud ice but with no precipitation included) in units of kg m⁻²...
Interval/period: N/A
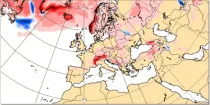
This chart shows the anomaly in precipitation (in mm of rainfall or rainfall equivalent) during a 24 hour period immediately prior to the chosen valid date/time...
Interval/period: N/A
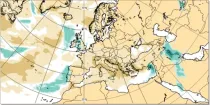
This chart shows the anomaly in snowfall (in mm of rainfall equivalent) during a 24 hour period immediately prior to the chosen valid date/time...
Interval/period: N/A
Forecast precipitation is considered to be snow if the model atmosphere above and at the ground surface is forecast to be below 0°C. Where the ground surface lies near the 0°C level...
Interval/period: N/A

Mean total swell wave direction is the spectrally averaged propagation direction of the swell waves (weighted by wave height) of the part of the spectrum that is NOT windsea...
Interval/period: N/A

Wave height is the vertical distance between trough and crest. Wave period is the time between the passage of one wave crest and the next. The arrow direction is the direction the waves are moving towards...
Interval/period: N/A
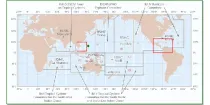
These charts provide information on current Tropical Cyclone activity. Select the ...
Interval/period: N/A