Datasets

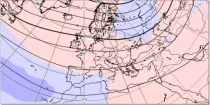
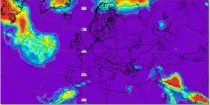
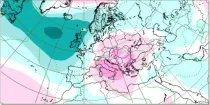
This chart shows 7-day mean anomalies of 500hPa geopotential height from the ECMWF Sub-seasonal ...
Interval/period: N/A
Interval/period: Thu, 06/01/1995 - Thu, 07/31/2025
Interval/period: Mon, 01/01/1951 - Sun, 07/05/2026
Detailed information on these EXPERIMENTAL products can be found
Interval/period: N/A
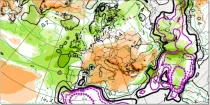
This chart shows 7-day mean anomalies of temperature at 10hPa from the ECMWF Sub-seasonal range ...
Interval/period: N/A
This chart shows probabilities for the 7-day mean anomalies of 2 m air temperature to be in ...
Interval/period: N/A
This chart shows probabilities that 7-day mean 2 m air temperatures (from the 101 forecast ...
Interval/period: N/A
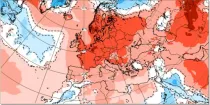
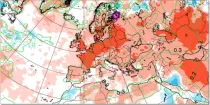
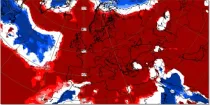
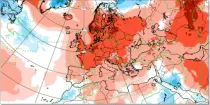
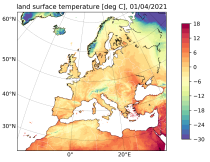
This chart shows 7-day mean anomalies of 2m air temperature from the ECMWF Sub-seasonal range ...
Interval/period: N/A
Detailed information on these EXPERIMENTAL products can be found
Interval/period: N/A
Detailed information on these EXPERIMENTAL products can be found
Interval/period: N/A
b'Detailed information on these EXPERIMENTAL products can be found
Interval/period: N/A
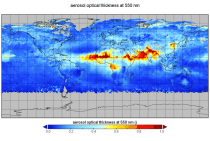
Interval/period: Wed, 01/01/2003 - Sun, 12/31/2017
carbon dioxide
methane
tropospheric ozone
stratospheric ozone
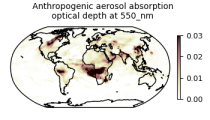
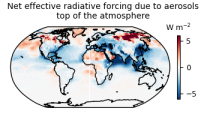
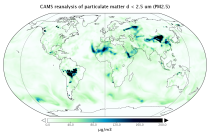
interactions between anthropogenic aerosols and radiation
interactions between anthropogenic aerosols and clouds
Interval/period: Wed, 01/01/2003 - Sun, 12/31/2017
Interval/period: Wed, 01/01/2003 - Thu, 10/31/2024
Interval/period: Wed, 01/01/2003 - Sun, 12/31/2023
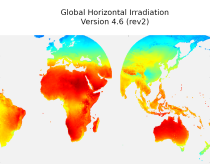
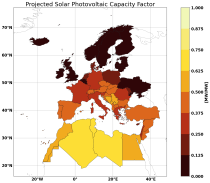
irradiation, as well as direct normal irradiation, on a latitude/longitude grid
covering land surfaces and coastal areas of Europe, Africa, Oceania, Eastern
South America, the Middle East and South-East Asia. It is created from 15 minute
resolved timeseries at each grid point. These timeseries were calculated by the
CAMS Solar Radiation Time Series Service and use information on aerosol, ozone
Interval/period: Sat, 01/01/2005 - Sun, 12/31/2023
Interval/period: Tue, 10/01/2002 - Mon, 06/30/2025
Interval/period: Sat, 09/01/1984 - Thu, 07/31/2025
Interval/period: Sun, 01/01/1950 - Wed, 12/01/2100
Interval/period: Sun, 01/01/1860 - Mon, 12/31/2300
Interval/period: Fri, 01/01/1982 - Tue, 12/31/2024
Interval/period: Sat, 01/01/1949 - Sun, 07/05/2026
Interval/period: Thu, 10/18/2018 - Wed, 07/31/2019
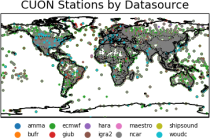
to contain all available observations from balloons ascents through the atmosphere.
The main geophysical variables are temperature, humidity, and wind speed and wind direction,
as functions of atmospheric pressure levels. The observation platforms include pilot balloons, radiosondes, and ozonesondes.
The main observation data sources are:
- the NOAA Integrated Global Radiosonde Archive (IGRA version 2),
- the NCAR Upper-Air Database (UADB), and
Interval/period: Tue, 01/01/1901 - Tue, 12/31/2024
Interval/period: Sun, 01/01/1950 - Fri, 12/31/2100