Datasets
(GNSS) radio signals.
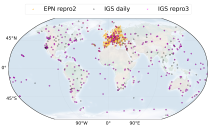
The initial data is collected from two in situ ground-based network of GNSS receivers – the International GNSS Service
(IGS) and EUREF Permanent Network (EPN). The IGS collects, archives, and freely distributes GNSS data from a
cooperatively operated global network of more than 500 ground-based GNSS stations since 1994. The EPN is a European
Interval/period: Mon, 01/01/1996 - Sat, 05/09/2026
Interval/period: Mon, 01/01/1979 - Mon, 12/31/2018
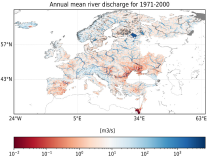
The data are bias adjusted using the Distribution Based Scaling (DBS) method versus the global reference dataset HydroGFD2.0, both bias adjustment method and global reference dataset developed by the Swedish Meteorological and Hydrological Institute (SMHI).
The DBS method is a parametric quantile-mapping variant.
Interval/period: Thu, 10/12/2000 - Thu, 10/18/2018
Interval/period: Tue, 07/05/1994 - Sun, 02/28/2021
Interval/period: N/A
Interval/period: Mon, 01/01/1979 - Mon, 06/30/2025
Interval/period: Sat, 01/01/1949 - Sat, 05/09/2026
Interval/period: Mon, 01/01/1979 - Sun, 02/01/2026
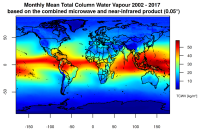
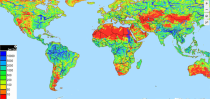
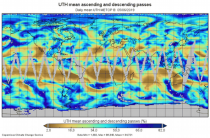
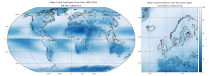
This catalogue entry presents two extensive, high-quality observational datasets of TCWV, specifically tailored for climate analysis and applications.
Interval/period: Tue, 01/01/2002 - Sun, 12/31/2017
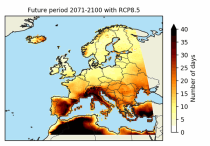
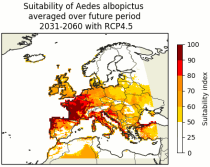
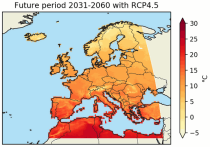
These heat wave and cold spell days are available for different future time periods and use different climate change scenarios.
Interval/period: Wed, 01/01/1986 - Mon, 12/31/2085

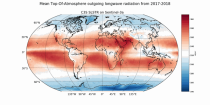
ECV datasets provide the empirical evidence needed to understand the current climate and predict future changes.
Interval/period: N/A
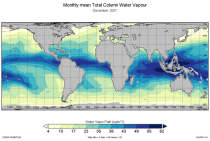
This catalogue entry provides the TCWV data product usually called Hamburg Ocean Atmosphere Parameters and Fluxes from Satellite Data (HOAPS).
Interval/period: Wed, 05/01/2002 - Thu, 03/01/2012
Interval/period: Tue, 12/01/2020 - Wed, 04/01/2026

Interval/period: Sun, 01/01/2017 - Fri, 05/01/2026

Interval/period: Sun, 01/01/2017 - Fri, 05/01/2026

Interval/period: Thu, 01/01/1981 - Fri, 05/01/2026
Interval/period: Fri, 01/01/1993 - Fri, 05/01/2026

Interval/period: Thu, 01/01/1981 - Fri, 05/01/2026
Interval/period: Thu, 01/01/1981 - Fri, 05/01/2026

Interval/period: Thu, 01/01/1981 - Fri, 05/01/2026
ECV datasets provide the empirical evidence needed to understand the current climate and predict future changes.
CIIs contain condensed climate information which facilitate relatively quick and efficient subsequent analysis. Therefore, CIIs make climate information accessible to application focussed users within a sector.
Interval/period: N/A
Interval/period: Wed, 01/01/1986 - Mon, 12/31/2085