Datasets
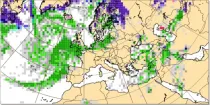
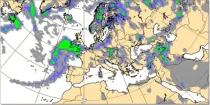
This chart shows probability information regarding precipitation type at the validity time ...
Interval/period: N/A
These charts show probabilities of multi-day precipitation accumulation. ...
Interval/period: N/A
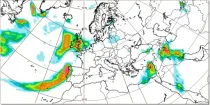
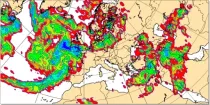
This chart shows probability information regarding point precipitation, as derived from the ...
Interval/period: N/A
This chart shows probability information derived from the ECMWF ensemble (ENS) regarding large ...
Interval/period: N/A
This chart shows probability information derived from the ECMWF ensemble (ENS) regarding the ...
Interval/period: N/A

This chart shows probability information regarding significant wave height derived from the ...
Interval/period: N/A
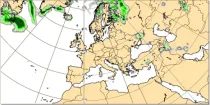
This chart shows probability information regarding snowfall derived from the ECMWF ensemble ...
Interval/period: N/A
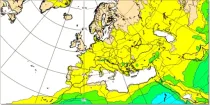
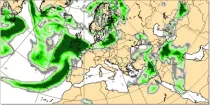
This chart shows probability information regarding total precipitation derived from the ECMWF ...
Interval/period: N/A

This chart shows probability information regarding visibility near the surface derived from the ...
Interval/period: N/A
This chart shows probability information regarding the maximum gust at 10 m above the earth's ...
Interval/period: N/A
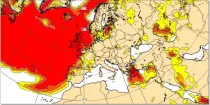
This chart shows probability information regarding 24 hour total precipitation derived from the ...
Interval/period: N/A

These charts show the probability of various mean periods of ocean waves 10-15 days ahead. The ...
Interval/period: N/A

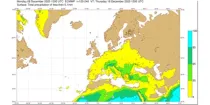
The ECMWF seasonal forecasts (SEAS5) are produced every month with a 51-member ensemble at a ...
Interval/period: N/A

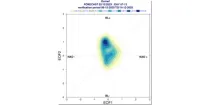
50-member extended-range hindcasts (46 days) targeting 2018 stratospheric sudden warming. Two initialisation dates considered: 2018-01-27 and 2018-01-31. Resolution TCo639L137. CY47R3.
Examples
Interval/period: N/A
These diagrams show the evolution of regimes indicative of likely weather by week around ...
Interval/period: N/A

The objective of UERRA is to produce ensembles of European regional meteorological reanalyses of Essential Climate Variables (ECVs) for several decades and to estimate the associated uncertainties in the data sets. It also includes recovery of historical (last century) data. UERRA datasets come from 5 Numerical Weather Predication models: COSMO, HARMONIE, MESAN, MESCAN-SURFEX and UM/4DVAR.
Interval/period: N/A
Contains uncompressed IEEE-754 Standard (1985) 64-bit floating-point single-time atmospheric and wave model (long window 4Dvar) outputs for experiment version 'hplp'. Surface, and model and pressure levels are available for the atmospheric model.
Examples
retrieve, anoffset=9, class=rd, date=2020-07-21, expver=hplp, levtype=sfc, param=2t, step=24, stream=lwda, time=00:00:00, type=fc, target='output.grib'Get day-one forecast of 2 metre air temperature (single level)
Interval/period: N/A
Uncoupled ensemble subseasonal reforecasts (ENS-U) with ocean and sea ice boundary conditions derived from observed values at initialisation time. In these experiments, SSTs are specified using daily values from the Operational Sea Surface Temperature and Ice Analysisthat are persisted as anomalies on top of a daily mean SST climatology (1979-2001) derived from the ERA40 reanalysis.
Interval/period: N/A
**Note:** In **June 2023** ECMWF implemented a **major upgrade ...**
Interval/period: N/A
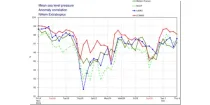
These diagrams compare recent ECMWF verification scores for Mean Sea Level Pressure with ...
Interval/period: N/A
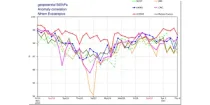
These diagrams compare recent ECMWF verification scores for 500 hPa height with those of other ...
Interval/period: N/A
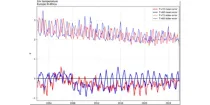
This diagram shows mean and standard deviation of errors in the HRES forecasts for several ...
Interval/period: N/A
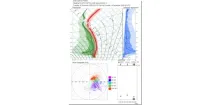
The Vertical Profiles display the vertical structure of the forecast model atmosphere in a familiar user friendly way. The vertical structure of temperatures (red) dewpoints (green) and dewpoint depressions (blue) from each ENS member ...
Interval/period: N/A
Predicting near surface visibility is dependent on predicting the correct dynamic and thermodynamic conditions in the boundary layer which can be highly variable. Fog is an extremely important weather hazard...
Interval/period: N/A