Datasets
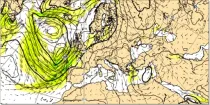
The air flow is not the same at all levels and can be very different in strength and direction when associated with vigorous weather systems...
Interval/period: N/A
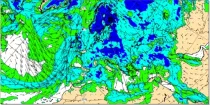
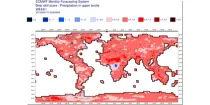
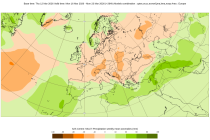
Uncoloured areas (relative humidity < 65%) are likely to be free of cloud. Coloured areas (relative humidity > 65%) show where moisture is likely to be available for cloud development...
Interval/period: N/A
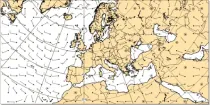
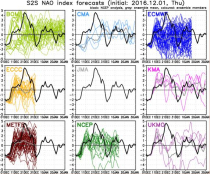
This chart shows 7-day mean anomalies of wind speed and direction from the ECMWF Sub-seasonal ...
Interval/period: N/A

Mean windsea wave direction is the spectrally averaged direction of propagation of the windsea waves (weighted by wave height). Arrow length is proportional to the speed of wave propagation...
Interval/period: N/A

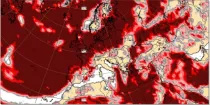
Significant windsea wave height can be shown to correspond to the average wave height of the top one-third highest windsea waves. Wave heights are shown in metres using colour shading...
Interval/period: N/A
Interval/period: Thu, 02/01/1940 - Fri, 01/23/2026
Interval/period: Sat, 03/01/1986 - Wed, 11/30/2011

WMO Core, previously known as WMO Essential, is available to the public and governed by the Creative Commons CC-4.0-BY licence and also ECMWF Terms of Use.
Interval/period: N/A
A routine inter-comparison of wave model forecast verification data was first established in 1995, developed around the exchange of model forecast data at an agreed list of moored buoy sites at which instrumented observations of significant wave height, wave period and wind speed are available over the WMO GTS.
Interval/period: N/A
WMO Recommended, previously known as WMO Additional, is available to the public and governed by the Creative Commons CC-4.0-BY licence and also ECMWF Terms Of Use.
Interval/period: N/A
**Note:** In **June 2023** ECMWF implemented a **major upgrade ...**
Interval/period: N/A
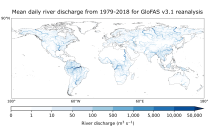
River discharge
Volumetric soil moisture
Snow water equivalent
Soil wetness index (root zone)
Runoff water equivalent (surface plus subsurface)
Interval/period: Thu, 10/11/2018 - Mon, 04/06/2026

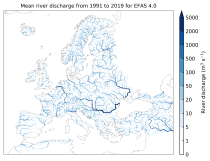
This dataset provides gridded modelled hydrological time series forced with medium-range meteorological forecasts. The data is a consistent representation of the most important hydrological variables across the European Flood Awareness System (EFAS) domain. The temporal resolution is sub-daily high-resolution and ensemble forecasts of:
River discharge
Soil moisture for three soil layers
Snow water equivalent
Interval/period: N/A
River discharge
Soil wetness index (root zone)
Snow water equivalent
Runoff water equivalent (surface plus subsurface)
Interval/period: Tue, 11/05/2019 - Thu, 05/07/2026

River discharge
Volumetric soil moisture
Snow water equivalent
Soil wetness index (root zone)
Runoff water equivalent (surface plus subsurface)
Interval/period: Tue, 01/01/1991 - Tue, 05/05/2026
River discharge
Soil wetness index (root zone)
Snow water equivalent
Runoff water equivalent (surface plus subsurface)
Interval/period: Mon, 01/01/1979 - Tue, 05/05/2026
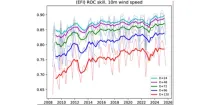
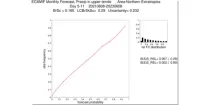
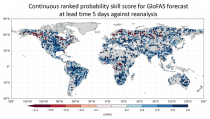
This diagram gives a measure of the effectiveness of the model. The drop-down menu can ...
Interval/period: N/A
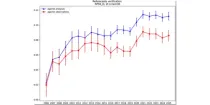
This diagram gives a measure of the effectiveness of the model. ...
Interval/period: N/A
**Note:** In **June 2023** ECMWF implemented a **major upgrade ...**
Interval/period: N/A
S2S project behind the dataset started in 2013 as a joint initiative of the World Weather Research Programme (WWRP) and the World Climate Research Programme (WCRP).
The goal of S2S project was to improve sub-seasonal forecast skill through combining multiple forecasting systems, enable multi-model evaluations and enhance knowledge sharing between operational centres.
Interval/period: Thu, 01/01/2015 - Wed, 05/06/2026
S2S project behind the dataset started in 2013 as a joint initiative of the World Weather Research Programme (WWRP) and the World Climate Research Programme (WCRP).
The goal of S2S project was to improve sub-seasonal forecast skill through combining multiple forecasting systems, enable multi-model evaluations and enhance knowledge sharing between operational centres.
Interval/period: Tue, 03/01/2011 - Tue, 06/09/2026

SNAPSI case study of Northern Hemisphere strong polar vortex case in the stratosphere, initialised on 2022-01-01. TCo319L137 resolution 51-member ensemble, integrated for 70 days.
Examples
Interval/period: N/A
SNAPSI case study of Northern Hemisphere strong polar vortex case in the stratosphere, initialised on 2022-01-01. TCo319L137 resolution 51-member ensemble, integrated for 70 days.
Examples
Interval/period: N/A

These charts show probability of various heights of significant waves 10-15 days ahead. The ...
Interval/period: N/A
This chart shows probability information regarding wind speeds at 100 m above the earth's ...
Interval/period: N/A