Datasets

Interval/period: N/A
Interval/period: N/A

Single prediction that uses
observations prior information about the Earth-system ECMWF's highest-resolution modelHRES Direct model output Products offers "High Frequency products"
4 forecast runs per day (00/06/12/18) (see dissemination schedule for details) Hourly steps to step 90 for all four runs.Not all post-processed Products are available at 06/18 runs or in hourly steps.
Interval/period: N/A
The sub-seasonal products comprise ensembles of individual forecasts up to 46 days and post-processed products of average conditions (e.g. weekly averages) and the associated uncertainty.
The purchase of the "Basic Set" +72, +96, +120, +144, +168 hrs is a mandatory prerequisite for the purchase of time steps in the range 12 to 66 hours.
The following sub-sets are available from the sub-seasonal forecast (46 days):
Interval/period: N/A
Interval/period: N/A
Interval/period: N/A
Interval/period: N/A
Interval/period: N/A
Interval/period: N/A
Interval/period: N/A
Interval/period: N/A
Interval/period: N/A
Interval/period: N/A
Interval/period: N/A
Interval/period: N/A
Interval/period: N/A
Interval/period: N/A
Detailed information on these EXPERIMENTAL products can be found
Interval/period: N/A
Detailed information on these EXPERIMENTAL products can be found
Interval/period: N/A
b'Detailed information on these EXPERIMENTAL products can be found
Interval/period: N/A
Detailed information on these EXPERIMENTAL products can be found
Interval/period: N/A

Various thermall comfort parameters showing thermal comfort
Interval/period: N/A
This product is derived from an ensemble of 50 model runs plus Control. Visibility is an ...
Interval/period: N/A

Simulated visible images show simulations of the upward flux of radiation (as would be detected by a weather satellite) derived from information using the model representation of temperatures and cloud layers.
Interval/period: N/A
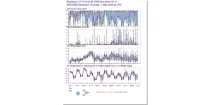
(Next AIFS version v2) AIFS ENS Meteograms show a probabilistic interpretation of the AIFS ENS forecasts for specific locations using a box and whisker plot. It shows the time evolution of the distribution of several meteorological parameters on a single diagram...
Interval/period: N/A