Datasets

Research forecast experiment produced with ECMWF IFS cycle 47R1, at TCo399 (25km), for the EUREC4A field campaign (15.01.2020-14.02.2020). Initialized from the hg1z analysis, with fields saved on model levels (bit identical to hg1z forecasts)
Examples
Interval/period: N/A
Coupled forecast with the new gravity-capillary model and nonlinear renormalisation of the growth rate in ecWAM. Tc1279 resolution (9km), from 2019-03-22 0 UTC, hourly output from step 1 to 72 hours code branch: wab_CY47R3.0_wam.IFS-1944
Examples
Interval/period: N/A
Coupled forecast WITHOUT the new gravity-capillary model and nonlinear renormalisation of the growth rate in ecWAM. Tc1279 resolution (9km), from 2019-03-22 0 UTC, hourly output from step 1 to 72 hours code branch: wab_CY47R3.0_wam.IFS-1944
Examples
Interval/period: N/A

This licence provides access to ECMWF interactive ecCharts tool to visualise analysis and forecast products Please note that access to the ecCharts is for End User use only (internal).
ECMWF ecCharts web service is available and we are pleased to be able to offer the service for evaluation to customers of ECMWF's web products.
Interval/period: N/A
Interval/period: Thu, 06/01/1995 - Thu, 07/31/2025
Interval/period: Mon, 01/01/1951 - Sat, 05/09/2026
Interval/period: Mon, 01/01/1979 - Thu, 04/30/2026
The AI Weather Quest (AI WQ), organised by ECMWF, is an ambitious international competition designed to harness artificial intelligence (AI) and machine learning (ML) in advancing weather forecasting.
Interval/period: N/A
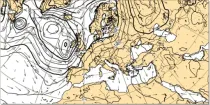
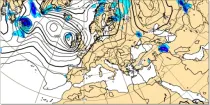
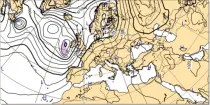
These charts show surface pressure patterns. Areas of high pressure (anticyclones) are usually associated with settled weather...
Interval/period: N/A
Dew Point Temperature at 2 m above the earth’s surface gives an indication of conditions which a person will experience or feel. High dewpoint temperatures inhibit heat loss from the body by perspriation and...
Interval/period: N/A
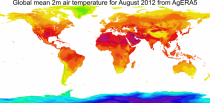
Temperatures at 2 m above the earth’s surface and winds at 10 m above the earth’s surface approximate most closely to the conditions that a person would experience.
Interval/period: N/A
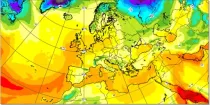
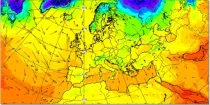
The 850 hPa level is usually just above the boundary layer and at this level the day-night variation in temperature is generally negligible...
Interval/period: N/A
Wind speed at 200 hPa highlights the jet stream (areas of strong winds in the upper troposphere) which can help identify movement and development of depressions...
Interval/period: N/A
Wind speeds near the surface are roughly proportional to the distance between isobars so closely packed isobars mean strong surface winds...
Interval/period: N/A
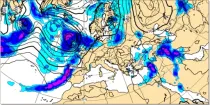
Precipitation totals include all precipitation types (rain, snow etc.) (in mm of rainfall or rainfall equivalent) falling in 6 hour or 12 hour periods using colour shading...
Interval/period: N/A
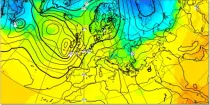
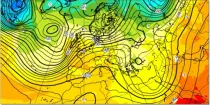
In the northern hemisphere the air rotates anti-clockwise around low contour centres and clockwise around the high contour centres. In the southern hemisphere the air rotates clockwise around low contour centres and ...
Interval/period: N/A
Total accumulated rainfall charts identify areas at greater risk of significant rainfall (or rain equivalent e.g.snowfall) but give no information regarding whether this occurs over a short or prolonged time period...
Interval/period: N/A

This display helps with the recognition of clouds of different layers, even when they overlap. Brighter colouring represents greater cloud cover. Cloud-free areas appear white while areas of full cloud cover at all levels appear dark grey (e.g. active fronts)...
Interval/period: N/A
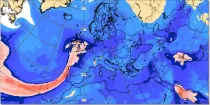
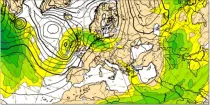
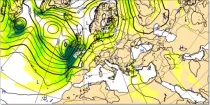
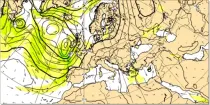
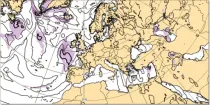
The charts show the forecast value of the vertically integrated total column water (vapour + cloud water + cloud ice but with no precipitation included) in units of kg m⁻²...
Interval/period: N/A
Forecast precipitation is considered to be snow if the model atmosphere above and at the ground surface is forecast to be below 0°C. Where the ground surface lies near the 0°C level...
Interval/period: N/A
The air flow is not the same at all levels and can be very different in strength and direction when associated with vigorous weather systems...
Interval/period: N/A
AIFS ENS: a deep learning-based system developed by ECMWF. It is initialised with ECMWF perturbed forecasts and operates at N320 (~0.25Deg) resolution
Interval/period: N/A
AIFS ENS: a deep learning-based system developed by ECMWF. It is initialised with ECMWF perturbed forecasts and operates at N320 (~0.25Deg) resolution
Interval/period: N/A