
Skilful forecasts of high-impact weather events depend on having an accurate estimate of the atmosphere in regions where errors can grow quickly by taking observations in those locations. Since 2019, the ensemble-based sensitivity method has been applied to ECMWF ensemble forecasts to provide guidance for operational reconnaissance flight planning for both tropical cyclones and atmospheric rivers. This article provides an overview of the technique and examples of how it has been applied to these two phenomena.
The ensemble-based sensitivity method
Accurate forecasts from numerical weather prediction models depend on having the best estimate of the atmosphere at the time when the model is started. This best estimate is obtained via data assimilation, which corrects a previous forecast based on the new information that comes from the global observation network. Most of the direct observations are concentrated over highly populated landmasses. In addition, there are numerous satellite-based sources of indirect observation information, such as satellite radiances and atmospheric motion vectors, that provide nearly global coverage. Despite this, there are numerous gaps in the observation network, which can result from the complexity of utilising radiances in the presence of clouds. This limits the ability to collect satellite observations in active weather regions. Moreover, atmospheric motion vectors are difficult to derive below the top layer of clouds, which in turn tends to yield many vectors either in the upper or lower troposphere.
The lack of comprehensive observation coverage means there can be many places in the atmosphere that are characterised by large uncertainty in the model initial conditions, which in turn will impact the skill of subsequent forecasts. These high uncertainty regions are not consistent from one forecast to another; therefore, it can be prohibitively expensive to deploy new observation platforms that would fill in these observation gaps. Consequently, it is worthwhile to develop ‘observation targeting’ techniques that can identify locations where taking additional observations would yield the biggest change in a subsequent forecast of a high-impact event, and to direct observation assets, such as an aircraft, to those locations so this information can be added to the global observation network.
There are multiple techniques that have been developed to provide this kind of guidance, all of which use some form of sensitivity analysis. In essence, sensitivity analysis describes how changes to a forecast field at some earlier lead time impact a forecast outcome at some later time. One such method is the ensemble-based sensitivity technique, which utilises the statistics of ensemble forecasts, such as the ECMWF ensemble, to derive forecast sensitivity. At its core, this technique involves computing the univariate linear regression between ensemble estimates of a forecast metric and the ensemble estimate of a forecast field at a given location at an earlier time. Here, the forecast metric can be anything that is a function of the model output variables, such as area-average precipitation or wind, tropical cyclone (TC) track forecasts, or changes in the spatial distribution of precipitation. The regression calculation can be repeated for a number of different locations, fields, and times, which allows the user to create sensitivity maps. Locations characterised by large sensitivity are locations where observations should be collected. Consequently, this methodology represents a post-processing of ensemble forecast output. As such, it is both computationally inexpensive (it can run on a desktop computer) and flexible in its applications. Furthermore, the set of python-based software used to carry out the calculations can be readily ported to numerous computing systems.
Application to tropical cyclones
Since 2015, this technique has been utilised in conjunction with ECMWF ensemble output to produce sensitivity guidance for tropical-cyclone-related field campaigns and operational reconnaissance. During 2015 and 2016, the United States National Oceanographic and Atmospheric Administration (NOAA) sponsored the Sensing Hazards with Operational Unmanned Technology (SHOUT) experiment, which was designed to test the utility of unmanned aerial vehicles (i.e. Global Hawk) for collecting TC observations, particularly in the event of a satellite outage. Flight plans were developed with Hurricane Weather Research and Forecasting (HWRF) and ECMWF sensitivity information for TC track-based metrics. Retrospective experiments with and without additional dropsonde data showed a statistically significant reduction in position error when dropsondes were assimilated, which is at least partially attributed to the flight tracks that were drawn based on sensitivity guidance.
Starting in 2019, ECMWF ensemble-based sensitivity information has been used by the United States National Hurricane Center (NHC) to develop flight tracks with the NOAA Gulfstream-IV (G-IV) aircraft, which is the focus of a NOAA Joint Hurricane Testbed (JHT) project (NOAA Award NA19OAR4590129). The purpose of these missions is to reduce the uncertainty in TC track forecasts that could impact either mainland US or US territories. Each mission deploys roughly 30 dropwindsondes in geographical locations that are expected to reduce TC track forecast uncertainty over a period of time, including at least one circumnavigation of the TC. These observations are subsequently assimilated by operational centres, including ECMWF. Given that TC motion is primarily determined by the TC steering flow, typically defined as the 300–850 hPa vertically-averaged wind, the main focus of these flights is to reduce the uncertainty in this field. At the beginning of this project, the sensitivity guidance was produced for selected storms; however, since 2020, ECMWF ensemble-based guidance has been produced for every storm in the Atlantic and Eastern Pacific basin present at 00 UTC.
From 2019 to 2021, ensemble-based sensitivity has been utilised to plan 58 individual G-IV missions for 16 different TCs. All missions require submitting a flight plan at least 24 hours prior to takeoff; therefore, the sensitivity of the track forecast is computed with respect to either a 36- or 48‑hour forecast. Figure 1 shows two examples of sensitivity output that was submitted to NHC for two prominent storms during this period, and the subsequent dropsonde locations. In both panels, the ensemble-mean steering wind is shown in wind barbs, while the shading denotes the sensitivity of the track forecast to the steering flow at the time of the potential aircraft mission. Wind is a vector quantity, so it is not possible to represent it, and hence the sensitivity, as a scalar value; instead, the wind must be represented in two components, such as the zonal and meridional wind. Most TCs do not move in the zonal and meridional directions exclusively; therefore, we developed a natural coordinate framework for the wind based on the direction that is characterised by the largest ensemble position variability. This approach accounts for the many instances when the position forecast is sensitive to a combination of the zonal and meridional wind. In the case of the Hurricane Dorian mission at 12 UTC on 1 September 2019, the primary direction of position variability is in the southwest–northeast direction; therefore, the sensitivity pattern represents the sensitivity of the position forecast to the southwest–northeast component of the wind. Here, warm colours indicate places where increasing the southwesterly component of the wind at this time is associated with a more northeasterly position for Dorian in the subsequent forecast, while cold colours indicate the opposite.
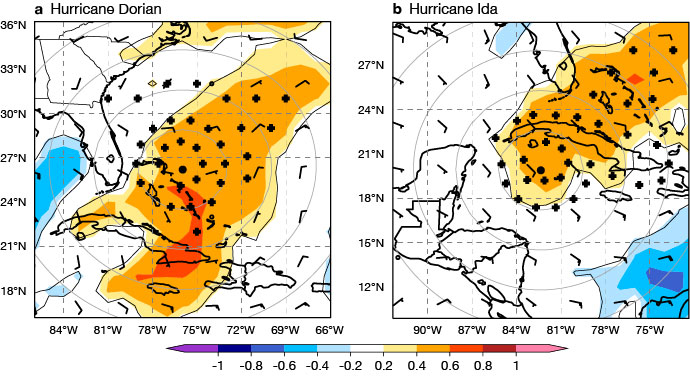
Regions characterised by large absolute values in sensitivity are suggestive of places where ensemble variations in the steering flow yield the largest change in the subsequent track forecast and hence where you would want to sample with observations. For this Dorian forecast, the greatest sensitivity is centered on the predicted position of the TC and extending both to the southwest and northeast of the storm. This sensitive region corresponds with a developing weakness in the subtropical ridge associated with a stagnation point in the steering flow. Increasing the southwesterly component of the wind during this time would move the TC out of the stagnation point, into greater influence by the midlatitude westerlies. Based on this sensitivity guidance, a G-IV flight pattern was developed to deploy dropsondes in a circle around the storm at two different radii as well as dropsondes to the northeast of the storm within the weakness in the subtropical ridge.
The second example is for Hurricane Ida at 12 UTC on 27 August 2021. This was a destructive storm for the Gulf of Mexico coast, whose remnants led to substantial flooding in New York City days after landfall. Similar to the Dorian example above, the track variability for this case is primarily in the southwest-to-northeast direction; therefore, the sensitivity of the track forecast is computed for the southwest component of the wind. At this time, the largest sensitivity is within 300 km of the centre of the TC and along the western edge of the subtropical ridge up to 1,200 km to the northeast of the storm centre. During this time, Ida is moving around the western edge of the subtropical ridge; therefore, if the ridge has less amplitude (i.e. there is more of a southerly wind), the TC will curve more to the north and east in the forecast. For this mission, the dropsondes were deployed at two different radii and to the northeast of the storm in recognition of the sensitive area to the northeast.
Application to atmospheric rivers
Based on the success of this approach for identifying sensitive regions for TC forecasts, the ensemble-based sensitivity method was expanded to identify target regions for precipitation forecasts along the west coast of the United States during atmospheric river (AR) events, which are responsible for a substantial portion of winter precipitation and high impact weather in this region. Atmospheric rivers tend to be horizontally narrow (hundreds of km) and characterised by a lack of upstream routine observations. In response, the Atmospheric River Recon (AR Recon) field programme was developed. Its aim is to improve the forecast skill of landfalling atmospheric rivers and their impacts to better inform decision-makers who are responsible for water management and flood preparedness in the western United States. Since 2019, the AR Recon programme has utilised ECMWF ensemble-based sensitivity information to identify locations where additional observations might reduce the uncertainty of precipitation forecasts for different regions in the western United States.
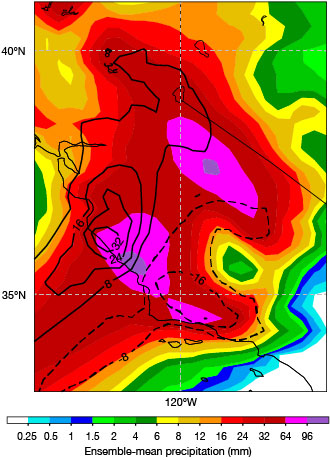
For this application, we use a forecast metric that measures the variability of precipitation within a specified geographical region. Specifically, we compute the empirical orthogonal function (EOF) decomposition of the ensemble gridded accumulated precipitation for a specified time period (typically 24 hours). This demonstrates the pattern that explains most of the variability of the precipitation forecast within that domain. The result describes how well each ensemble member matches that precipitation perturbation pattern and is used as the forecast metric within the sensitivity calculations. The advantage of this approach is that it provides a measure of the precipitation variability in the model’s framework, especially in regions of complex terrain, without being overly restricted by fixed geographic polygons, like rectangles. Figure 2 shows an example of this EOF-based metric for the ECMWF ensemble 24‑hour precipitation forecasts ending at 12 UTC on 28 January 2021. This was the end of a six-day sequence of AR Recon flights that culminated in a significant flooding event in central California. Here, the highest ensemble-mean precipitation rates are associated with an AR that is nearly stationary along the central California coast. The EOF pattern, which explains 54% of the precipitation forecast variance over this domain, is characterised by a positive precipitation perturbation on the northern side of the AR along the California coast and a negative perturbation along the California coast to the south of the AR. In total, this precipitation perturbation pattern suggests that the leading mode of variability is a north–south shift of the precipitation along the California coast.
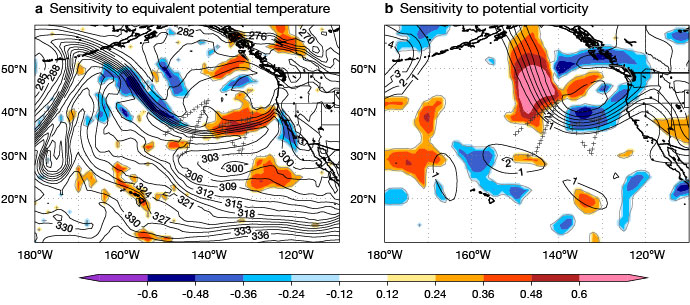
Similar to the TC application, these sensitivity patterns are computed on a daily basis based on 00 UTC ECMWF ensemble output. They are utilised as part of the guidance suite for planning flight tracks for the NOAA G-IV (typically based in Honolulu, Hawaii) and the US Air Force C‑130 (typically based along the US west coast) aircraft. The metric region is determined for each mission based on forecast precipitation in coordination with the AR Recon Mission Scientist and other forecast team members. Figure 3 shows the sensitivity of this precipitation forecast to the 850 hPa equivalent potential temperature and 250 hPa potential vorticity (PV) at the time of planning for Intensive Observation Period 7 (00 UTC on 27 January). These two fields are routinely used in flight planning because they sample upper and lower tropospheric features and are often characterised by the largest sensitivity based on previous cases. During this time, there is negative sensitivity on the eastern end of the equivalent potential temperature maximum making landfall over central California along 120°W, and positive sensitivity along the cold front along 36°N, such that shifting this feature to the north at this time is associated with a northward shift in precipitation later in the forecast. In response, the C-130 dropsondes sampled the region of positive sensitivity well. At 250 hPa, the main sensitive region is along the PV gradient associated with the ensemble-mean trough centered at 135°W, such that decreasing the PV on the southern end and increasing the PV on the western end of the trough is associated with the subsequent northward shift of the precipitation. Based on the distance from Honolulu to the sensitive location, it was difficult to completely sample the sensitive region, but the G‑IV flight was able to capture the southern end of the positive sensitivity region.
Summary
Ensemble-based sensitivity is an ensemble post-processing technique that can provide valuable insight into the dynamics and error growth associated with high-impact weather systems and guidance on where to take observations during these events. Applying this method to many TCs indicates that TC track forecasts tend to be most sensitive to the near-storm steering flow and to weaknesses in the subtropical ridge. For AR events, the main sensitivity appears to be associated with the position of lower-tropospheric fronts, and upper-tropospheric shortwave troughs, which can subsequently impact the position of the lower-tropospheric fronts. This method will continue to be used as operational guidance for future target planning operations for both TCs and AR precipitation forecasts. Future work will focus on more impact-based forecast metrics, like TC wind, precipitation, and storm surge forecasts, as well as more explicit hydrological applications.
Further reading
Ancell, B. & G.J. Hakim, 2007: Comparing adjoint and ensemble sensitivity analysis with applications to observation targeting. Mon. Wea. Rev., 135, 4117–4134.
Ralph, F.M., F. Cannon, V. Tallapragada, C.A. Davis, J.D. Doyle, F. Pappenberger et al., 2020: West Coast Forecast Challenges and Development of Atmospheric River Reconnaissance. Bull. Amer. Meteor. Soc., 101, E1357–E1377.
Torn, R.D. & G.J. Hakim, 2008: Ensemble-based sensitivity analysis. Mon. Wea. Rev., 136, 663–677.
Wick, G.A., J.P. Dunion, P.G. Black, J.R. Walker, R.D. Torn, A.C. Kren et al., 2020: NOAA’S Sensing Hazards With Operational Unmanned Technology (SHOUT) Experiment. Bull. Amer. Meteor. Soc., 101, E968–E987.