LSWT from satellite radiometers: download and extraction; visualization of timeseries and location of the lake centre; quality and uncertainty
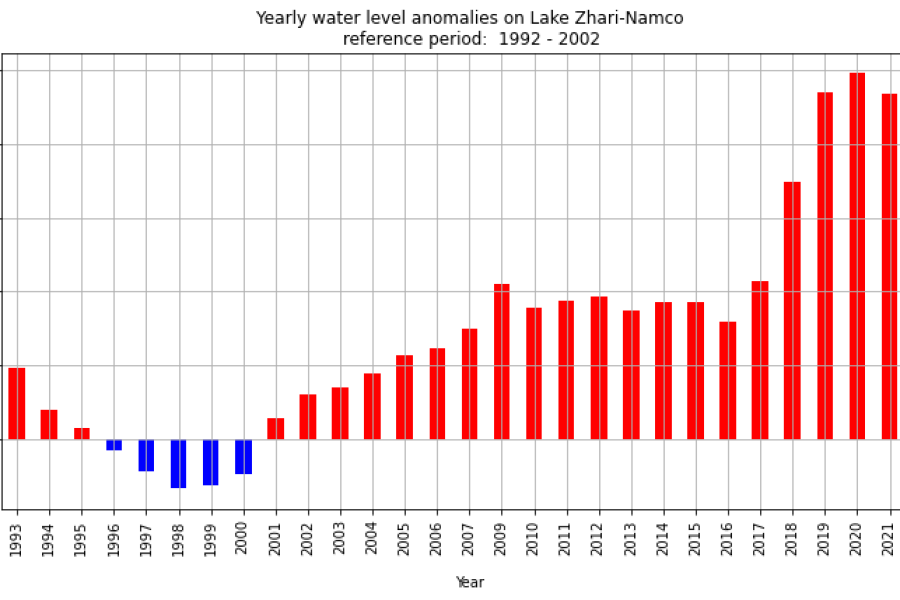
How to access the water level data for a specified lake and how to visualise its timeseries and yearly water level anomalies
GTSM reanalysis experiment data are used to explore historical storm events.
How to use data from CDS to compute an agroclimatic indicator, specifically, the "Warm and wet days" (WW) indicator
OC and SST datasets from CDS: subset and download, visualise time series, aggregate daily to monthly, calculate anomalies
Practical introduction to the Sea level gridded data: plotting data during an El Niño event and over a strong current
Surface Albedo product. Three case studies: data retrieval, visualisation, time-series creation, set up Python environment
LAI and fAPAR retrieved with satellite remote sensing. Computation of inverse variance weights
Access and use of satellite-derived Greenhouse Gas (GHG) atmospheric carbon dioxide (CO2) Level 2 data product.
How to access, read and use Greenhouse Gas atmospheric carbon dioxide and methane data: temporal and spatial variation.
This notebook demonstrates the conversion from effective to true LAI using a clumping factor. It includes the propagation of the uncertainty to the true LAI, including many but not all additional sources of uncertainty.
Retrieve data on Burned Area from the C3S Climate Data Store, examining, subsetting, saving and re-projecting it