Showing 13 - 24 of 56 results
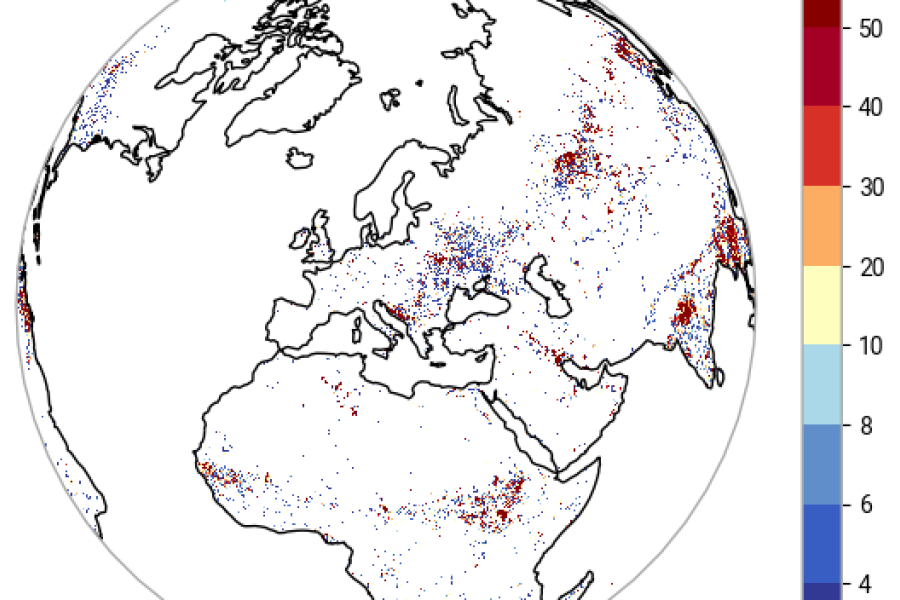
Exploring Fire - Active Fire & Fire Radiative Power products available through the C3S

Exploring Fire - Active Fire & Fire Radiative Power products available through the C3S

Format: notebook
Published: November 20, 2025

Fire Radiative Power (FRP) and Active Fire data enable us to quantify biomass burning, improve the accuracy of our estimates of greenhouse gas and aerosol emissions, and support real-time monitoring of fire activity.

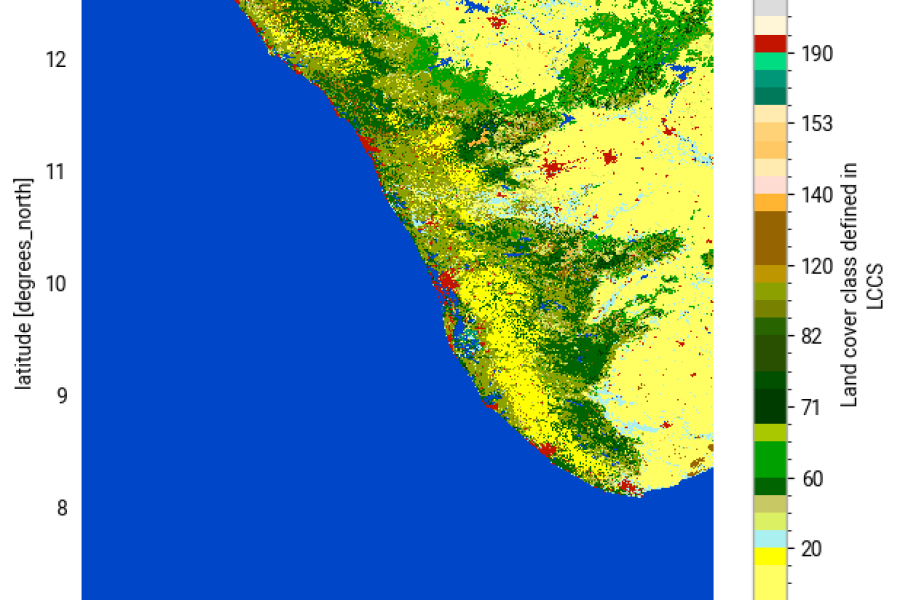
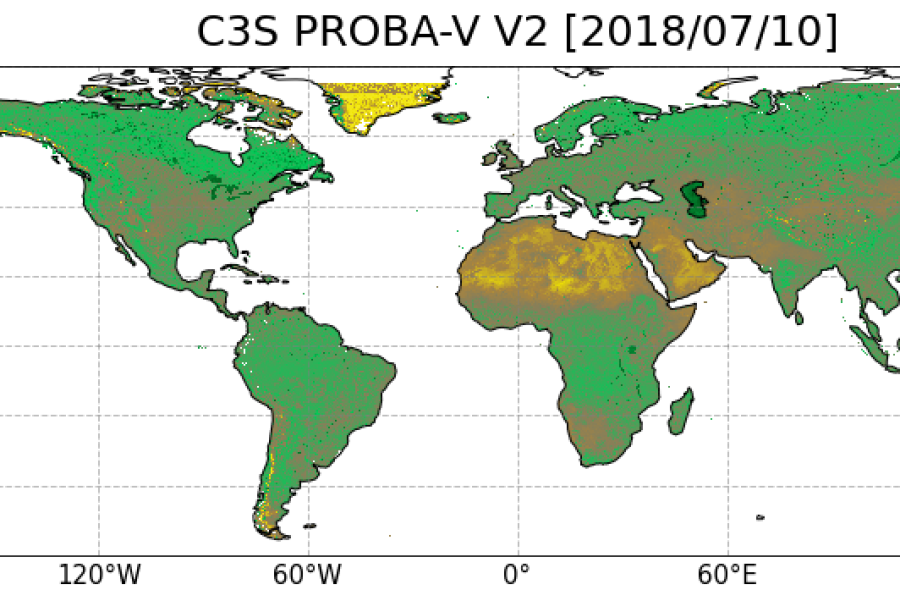
Exploring global Land Cover available through the Climate Data Store (CDS)

Exploring global Land Cover available through the Climate Data Store (CDS)

Format: notebook
Published: November 20, 2025

Retrieve landcover data from the C3S Climate Data Store, examining, subsetting, saving and re-projecting.

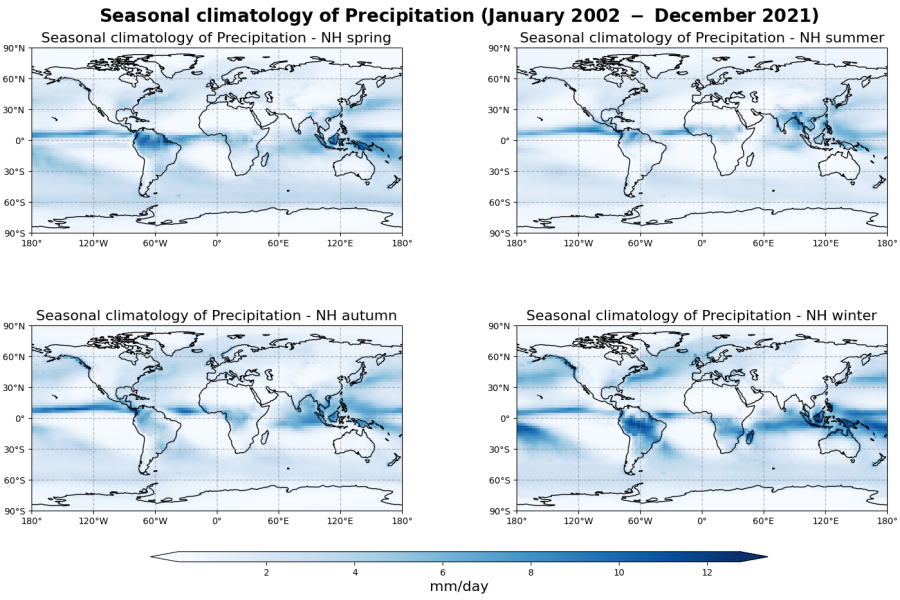
Exploring precipitation information in the GIRAFE dataset

Exploring precipitation information in the GIRAFE dataset

Format: notebook
Published: November 6, 2025

Using GIRAFE data record for climate studies. Two use cases: analysis of time averaged and seasonal data; trend analysis

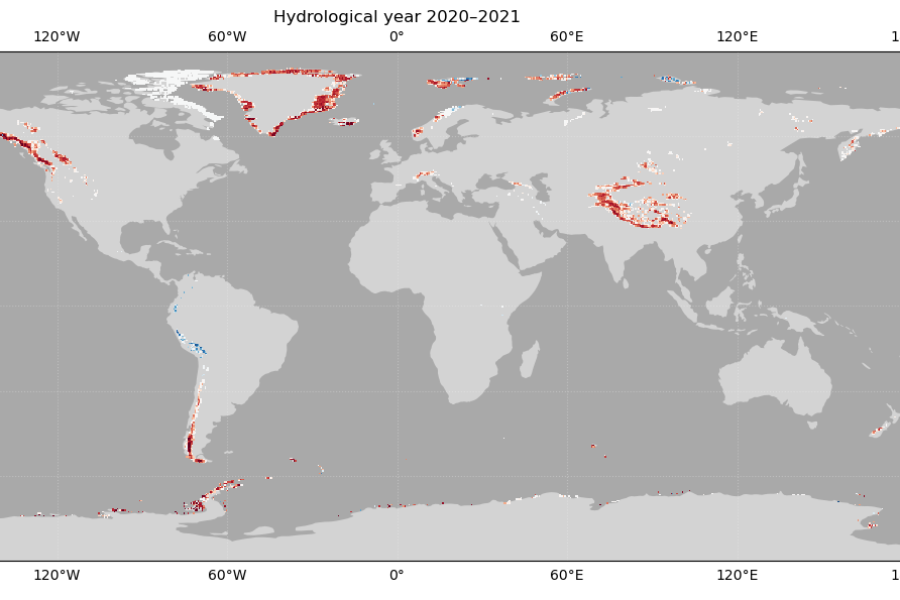
Explore data on glacier mass change available on the Climate Data Store

Explore data on glacier mass change available on the Climate Data Store

Format: notebook
Published: November 6, 2025

Glacier mass change dataset from the CDS: inspection, plotting and animation of the time series of the annual gridded files

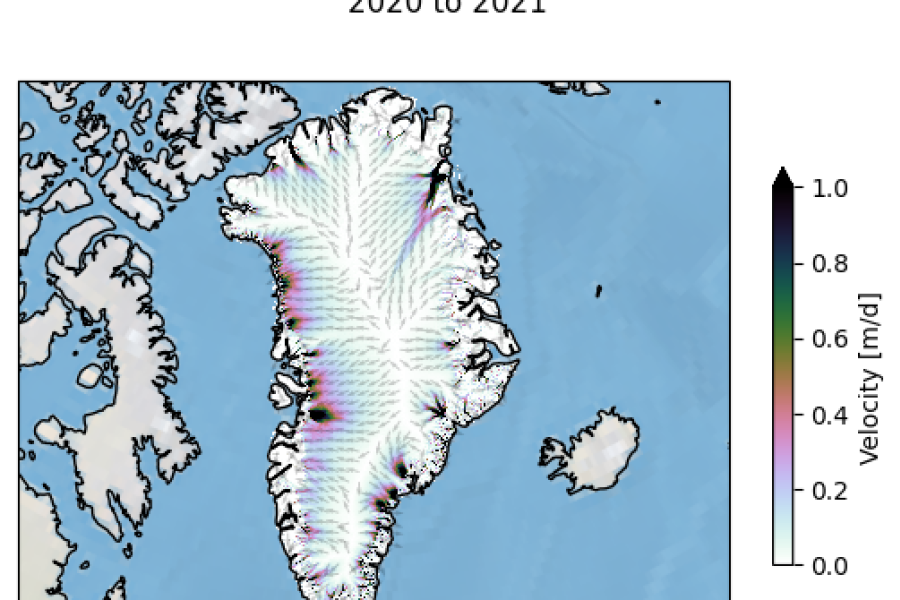
Access and visualisation of the Greenland Ice Sheet velocity data

Access and visualisation of the Greenland Ice Sheet velocity data

Format: notebook
Published: November 6, 2025

Plotting velocity maps and flow vectors of the Greenland Ice Sheet and its major outlet glaciers, using ice velocity data

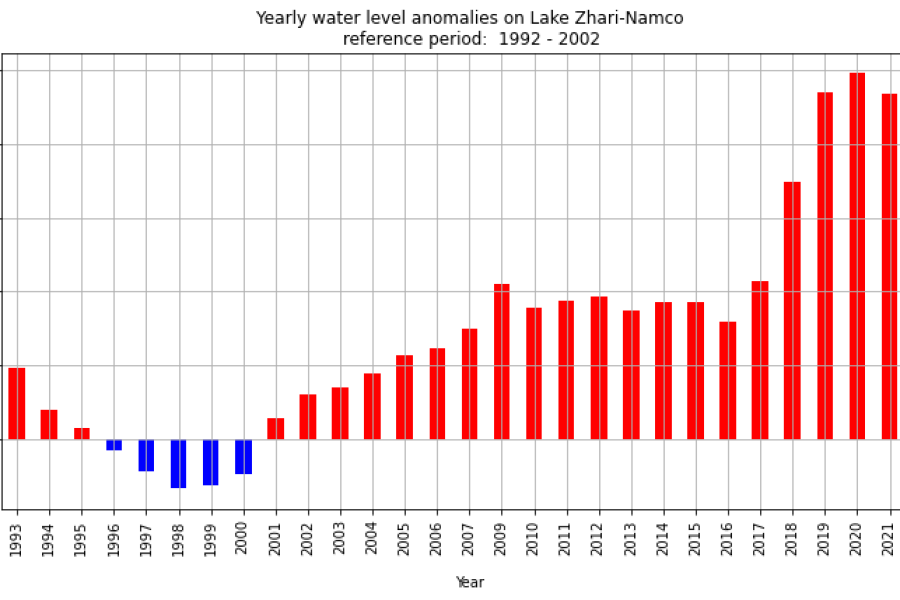
Tutorial: Data Access and  Visualisation of Lake Water Level (LWL) timeseries

Tutorial: Data Access and Visualisation of Lake Water Level (LWL) timeseries

Format: notebook
Published: November 6, 2025

How to access the water level data for a specified lake and how to visualise its timeseries and yearly water level anomalies

Exploring the Climate Change Service (C3S) Surface Albedo product available through the Climate Data Store (CDS)

Exploring the Climate Change Service (C3S) Surface Albedo product available through the Climate Data Store (CDS)

Format: notebook
Published: November 6, 2025

Surface Albedo product. Three case studies: data retrieval, visualisation, time-series creation, set up Python environment

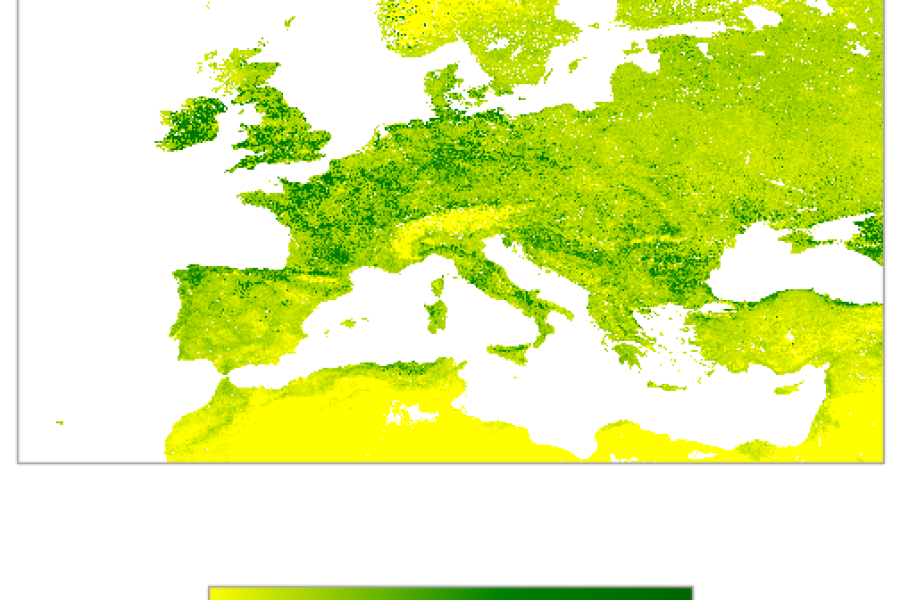
Computing the time average of LAI and fAPAR using inverse variance weights

Computing the time average of LAI and fAPAR using inverse variance weights

Format: notebook
Published: November 6, 2025

LAI and fAPAR retrieved with satellite remote sensing. Computation of inverse variance weights

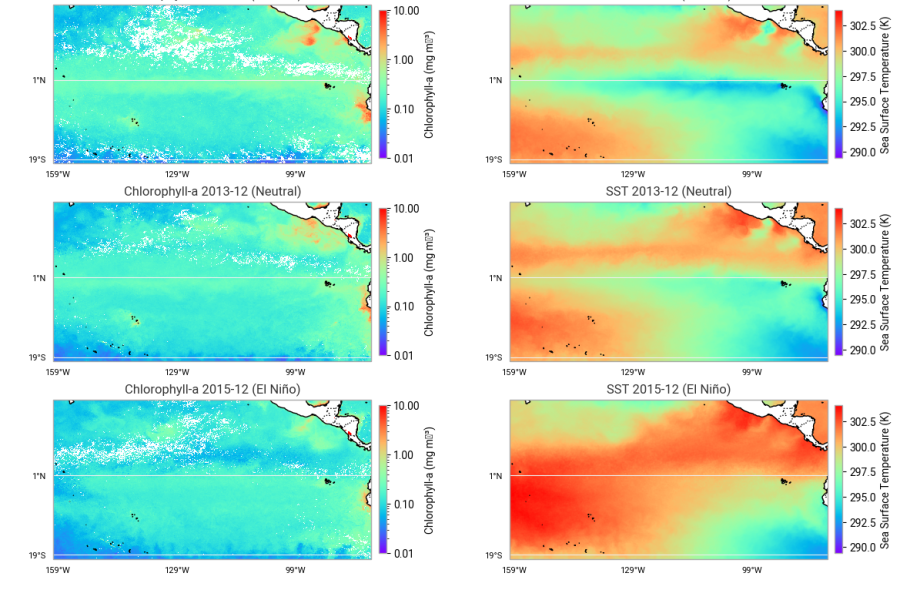
Analyzing Ocean Colour and Sea Surface Temperature during El Niño and La Niña Events

Analyzing Ocean Colour and Sea Surface Temperature during El Niño and La Niña Events

Format: notebook
Published: November 6, 2025

OC and SST datasets from CDS: subset and download, visualise time series, aggregate daily to monthly, calculate anomalies

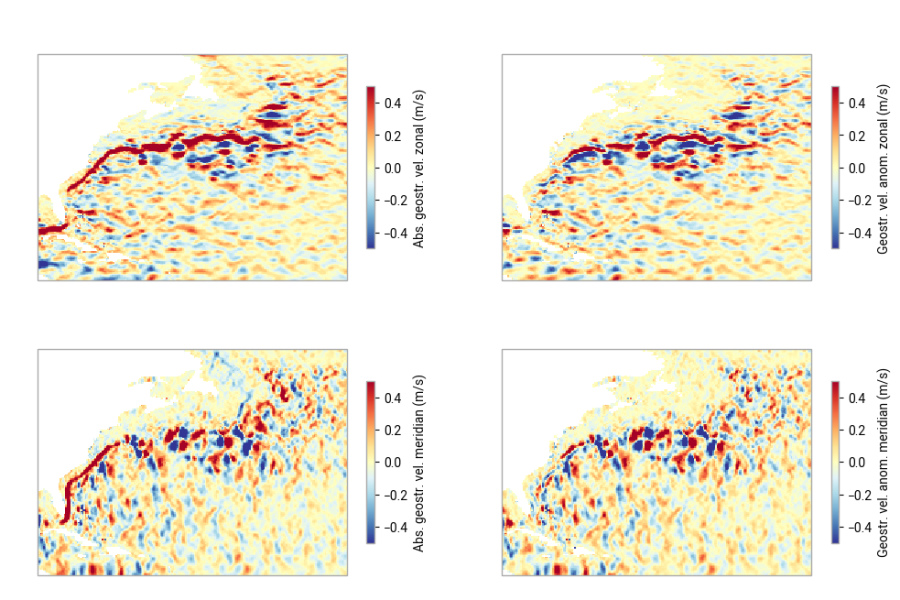
Looking at Sea Level and derived Surface Current data

Looking at Sea Level and derived Surface Current data

Format: notebook
Published: November 6, 2025

Practical introduction to the Sea level gridded data: plotting data during an El Niño event and over a strong current

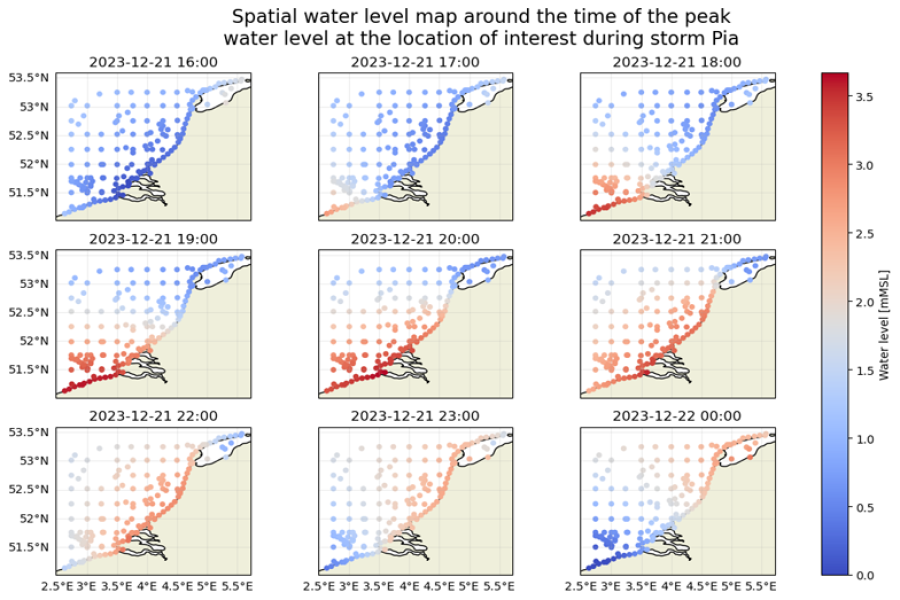
Exploring coastal water levels and storm surges from a global tide and surge model

Exploring coastal water levels and storm surges from a global tide and surge model

Format: notebook
Published: November 6, 2025

GTSM reanalysis experiment data are used to explore historical storm events.

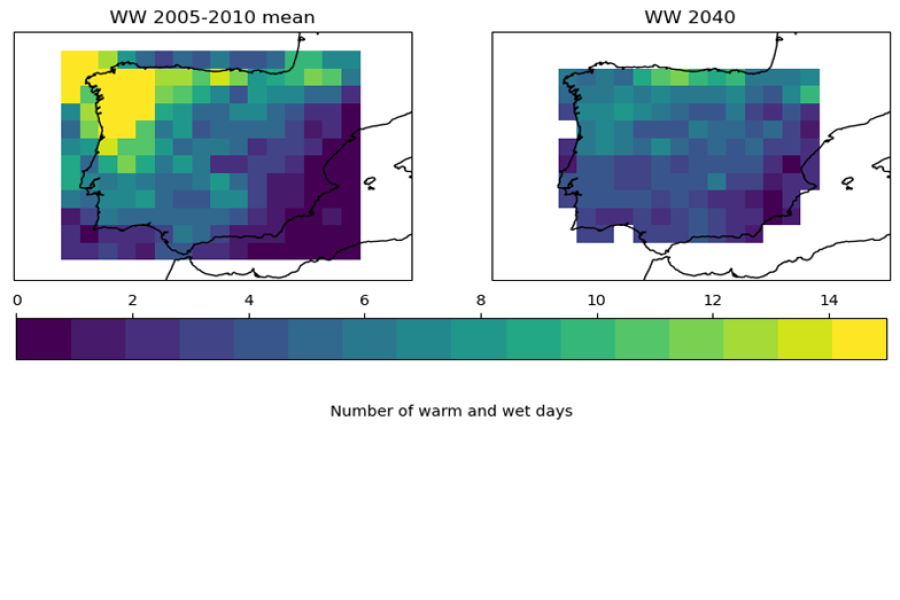
Computing warm & wet days agro-climatic indicator under future climate change

Computing warm & wet days agro-climatic indicator under future climate change

Format: notebook
Published: November 6, 2025

How to use data from CDS to compute an agroclimatic indicator, specifically, the "Warm and wet days" (WW) indicator