Datasets

These charts show indices which indicate the susceptibility of the troposphere to support free convection. Typical values of the different indices depend on location and...
Interval/period: N/A

This diagram shows time evolution of a Madden-Julian Oscillation (MJO) index. ...
Interval/period: N/A

This chart shows probability information regarding lightning flash density derived from the ...
Interval/period: N/A

This chart shows probability information regarding CAPE shear derived from the ECMWF ensemble ...
Interval/period: N/A

This chart shows probability information regarding MUCAPE derived from the ECMWF ensemble (ENS) ...
Interval/period: N/A

Interval/period: Wed, 01/01/2003 - Wed, 12/03/2025
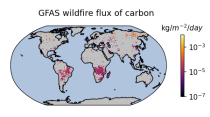
Emissions of atmospheric pollutants from biomass burning and vegetation fires are key drivers of the evolution of atmospheric composition, with a high degree of spatial and temporal variability, and an accurate representation of them in models is essential.
Interval/period: N/A
Interval/period: Sat, 01/01/2000 - Thu, 12/31/2020

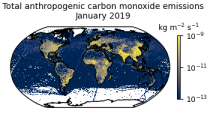
This data set contains gridded distributions of global anthropogenic and natural emissions.
Interval/period: N/A
Interval/period: Mon, 01/01/1979 - Tue, 12/31/2024

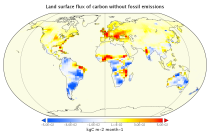
This data set contains net fluxes at the surface, atmospheric mixing ratios at model levels, and column-mean atmospheric mixing ratios for carbon dioxide (CO2), methane (CH4) and nitrous oxide (N20).
Interval/period: N/A

These charts show areas where anomalous CAPE are likely to occur.
Interval/period: N/A

These charts show areas where anomalous CAPE Shear are likely to occur.
Interval/period: N/A

MUCAPE (Most Unstable Convective Available Potential Energy) is an indicator of atmospheric instability (the susceptibility of the troposphere to support free convection) and...
Interval/period: N/A