Datasets
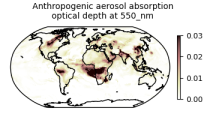
This dataset provides aerosol optical depths and aerosol-radiation radiative effects for four different aerosol origins: anthropogenic, mineral dust, marine, and land-based fine-mode natural aerosol. The latter mostly consists of biogenic aerosols.
Interval/period: N/A
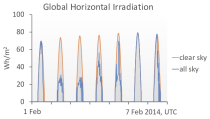
The CAMS solar radiation services provide historical values (2004 to present) of global (GHI), direct (BHI) and diffuse (DHI) solar irradiation, as well as direct normal irradiation (BNI). The aim is to fulfil the needs of European and national policy development and the requirements of both commercial and public downstream services, e.g. for planning, monitoring, efficiency improvements and the integration of solar energy systems into energy supply grids.
Interval/period: N/A
This dataset provides daily air quality analyses and forecasts for Europe.
Interval/period: N/A
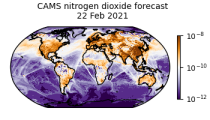
CAMS produces global forecasts for atmospheric composition twice a day. The forecasts consist of more than 50 chemical species (e.g. ozone, nitrogen dioxide, carbon monoxide) and seven different types of aerosol (desert dust, sea salt, organic matter, black carbon, sulphate, nitrate and ammonium aerosol). In addition, several meteorological variables are available as well.
Interval/period: N/A
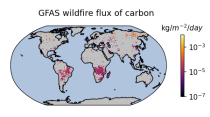
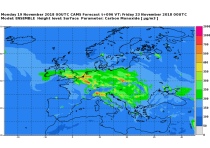
Emissions of atmospheric pollutants from biomass burning and vegetation fires are key drivers of the evolution of atmospheric composition, with a high degree of spatial and temporal variability, and an accurate representation of them in models is essential.
Interval/period: N/A

This chart shows probability information regarding lightning flash density derived from the ...
Interval/period: N/A

This chart shows probability information regarding CAPE shear derived from the ECMWF ensemble ...
Interval/period: N/A

This chart shows probability information regarding MUCAPE derived from the ECMWF ensemble (ENS) ...
Interval/period: N/A

These charts show areas where anomalous CAPE are likely to occur.
Interval/period: N/A

These charts show areas where anomalous CAPE Shear are likely to occur.
Interval/period: N/A

These charts show indices which indicate the susceptibility of the troposphere to support free convection. Typical values of the different indices depend on location and...
Interval/period: N/A

This diagram shows time evolution of a Madden-Julian Oscillation (MJO) index. ...
Interval/period: N/A

MUCAPE (Most Unstable Convective Available Potential Energy) is an indicator of atmospheric instability (the susceptibility of the troposphere to support free convection) and...
Interval/period: N/A