Datasets
Interval/period: Sun, 01/01/1860 - Mon, 12/31/2300
Interval/period: Sat, 01/01/1949 - Sun, 07/05/2026
Interval/period: Thu, 10/18/2018 - Wed, 07/31/2019
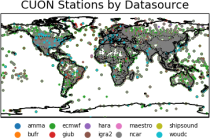
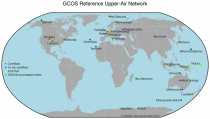
to contain all available observations from balloons ascents through the atmosphere.
The main geophysical variables are temperature, humidity, and wind speed and wind direction,
as functions of atmospheric pressure levels. The observation platforms include pilot balloons, radiosondes, and ozonesondes.
The main observation data sources are:
- the NOAA Integrated Global Radiosonde Archive (IGRA version 2),
- the NCAR Upper-Air Database (UADB), and
Interval/period: Tue, 01/01/1901 - Tue, 12/31/2024
Interval/period: Sun, 01/01/1950 - Fri, 12/31/2100
Interval/period: Mon, 01/01/1979 - Mon, 06/30/2025
Interval/period: Sun, 01/01/1860 - Mon, 12/31/2300
Interval/period: Wed, 01/01/1800 - Fri, 12/31/2100
Interval/period: Sun, 01/01/1860 - Mon, 12/31/2300
Interval/period: Sun, 01/01/1860 - Mon, 12/31/2300
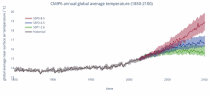
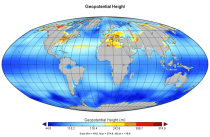
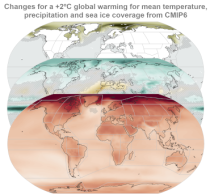
CMIP6 data underpins the Intergovernmental Panel on Climate Change 6th Assessment Report. The use of these data is mostly aimed at:
addressing outstanding scientific questions that arose as part of the IPCC reporting process;
improving the understanding of the climate system;
Interval/period: Sun, 01/01/1860 - Mon, 12/31/2300
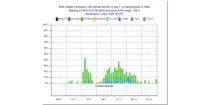
This product shows ENS meteograms from next model version of IFS cycle 50R1 that is planned to be ...
Interval/period: N/A
**This product shows ENS meteograms from next model version of IFS cycle 50R1 that is planned ...**
Interval/period: N/A
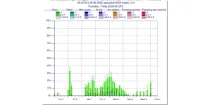
**Next IFS version (cycle 50r1)**. This product shows the probability of visibility (%) in 2 ...
Interval/period: N/A
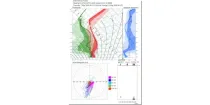
(Next IFS version - CY50R1) Probability of precipitation type (%) in precipitation rate categories ...
Interval/period: N/A
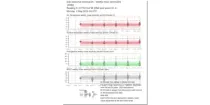
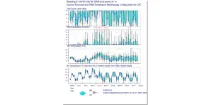
(New IFS cycle 50R1) The Vertical Profiles display the vertical structure of the forecast model atmosphere in a familiar user friendly way. The vertical structure of temperatures (red) dewpoints (green) and dewpoint depressions (blue) from each ENS member ...
Interval/period: N/A
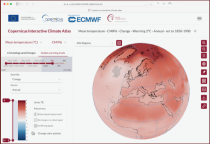
These daily and monthly data are pre-calculated and have the following types depending on the variables: daily and monthly averages, extremes and totals.
Interval/period: Sat, 09/01/1990 - Sat, 02/28/2026
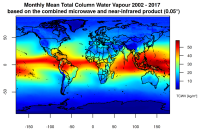
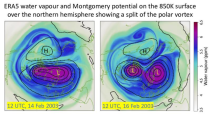
This catalogue entry presents two extensive, high-quality observational datasets of TCWV, specifically tailored for climate analysis and applications.
Interval/period: Tue, 01/01/2002 - Sun, 12/31/2017
Interval/period: Sun, 01/01/1860 - Mon, 12/31/2300
Interval/period: Sun, 01/01/1860 - Mon, 12/31/2300
Data is available from 1940 onwards. ERA5 replaces the ERA-Interim reanalysis.
Interval/period: Mon, 01/01/1940 - Fri, 12/06/2024
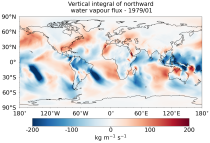
The vertically integrated budget diagnostics include the tendencies and lateral fluxes of total energy, water vapour, and latent heat (with the latent heat of vaporization varying with temperature). In addition, the divergences of the lateral fluxes are provided.
Interval/period: Mon, 01/01/1979 - Sun, 07/05/2026
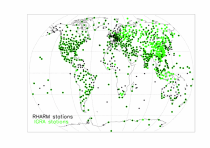
The first is version 2 of the Integrated Global Radiosounding Archive (IGRA) from 1978 which incorporates global
radiosounding profiles of temperature, humidity and wind from a large number of data sources,
which is 30% larger than the previous version 1. IGRA v2 is the result of quality assurance procedures applied to the
Interval/period: Sun, 01/01/1978 - Sun, 07/05/2026
Interval/period: Sun, 01/01/1978 - Wed, 10/17/2018
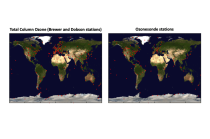
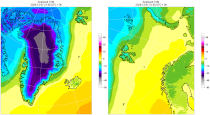
The total ozone estimates are based on solar UV radiation measurements made by ground-based spectrophotometers (Dobson or Brewer type spectrophotometers).
The vertical profiles of ozone concentration are estimated primarily using ozonesonde observations.
Data are available for 159 Dobson stations, 109 Brewer stations and 135 ozonesondes stations.
Interval/period: Tue, 01/01/1924 - Sun, 07/05/2026