Datasets

These charts show indices which indicate the susceptibility of the troposphere to support free convection. Typical values of the different indices depend on location and...
Interval/period: N/A

This diagram shows time evolution of a Madden-Julian Oscillation (MJO) index. ...
Interval/period: N/A
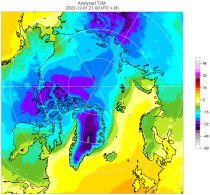
Interval/period: Wed, 01/01/1986 - Sun, 12/31/2023
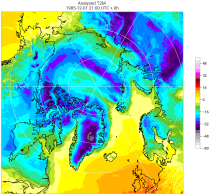
Interval/period: Wed, 01/01/1986 - Sun, 12/31/2023

This chart shows probability information regarding lightning flash density derived from the ...
Interval/period: N/A

This chart shows probability information regarding CAPE shear derived from the ECMWF ensemble ...
Interval/period: N/A

This chart shows probability information regarding MUCAPE derived from the ECMWF ensemble (ENS) ...
Interval/period: N/A
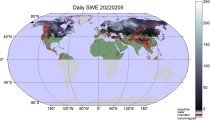
These daily and monthly data are pre-calculated and have the following types depending on the variables: daily and monthly averages, extremes and totals.
Interval/period: Sat, 09/01/1990 - Sat, 02/28/2026

These charts show areas where anomalous CAPE are likely to occur.
Interval/period: N/A

These charts show areas where anomalous CAPE Shear are likely to occur.
Interval/period: N/A
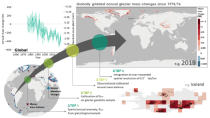
Interval/period: Wed, 01/01/1975 - Sat, 05/09/2026
Interval/period: Sat, 01/01/2000 - Sun, 12/31/2000
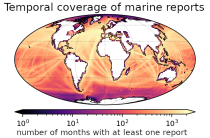
and naval ships, drifting buoys and other platforms and vessels over
the global ocean. Data have been collated and harmonised and quality control checks have been performed, but no attempt
has been made to assess or correct for potential biases.
Data are provided for a range of commonly observed variables.
Interval/period: Tue, 01/01/1850 - Sat, 05/09/2026
Interval/period: Wed, 01/01/2003 - Sat, 12/31/2022
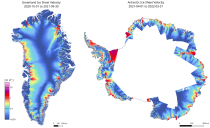
Interval/period: Wed, 01/01/1992 - Sat, 05/09/2026
Interval/period: Sun, 10/01/2017 - Sat, 05/09/2026

MUCAPE (Most Unstable Convective Available Potential Energy) is an indicator of atmospheric instability (the susceptibility of the troposphere to support free convection) and...
Interval/period: N/A
Interval/period: Tue, 01/02/1979 - Sat, 05/09/2026