Displaying 51 - 75 of 115
This catalogue entry provides daily climate projections on pressure levels from a large number of experiments, models, members and time periods computed in the framework of fifth phase of the Coupled Model Intercomparison Project (CMIP5). The term "pressure levels" is used to express that the variables were computed at multiple vertical levels, which may differ in number and location among the different models.

calendar_today Interval/period: Sun, 01/01/1860 - Mon, 12/31/2300
This catalogue entry provides daily climate projections on single levels from a large number of experiments, models, members and time periods computed in the framework of the fifth phase of the Coupled Model Intercomparison Project (CMIP5). The term "single levels" is used to express that the variables are computed at one vertical level which can be surface (or a level close to the surface) or a dedicated pressure level in the atmosphere. Multiple vertical levels are excluded from this catalogue entry.

calendar_today Interval/period: Wed, 01/01/1800 - Fri, 12/31/2100
This catalogue entry provides monthly climate projections on pressure levels from a large number of experiments, models, members and time periods computed in the framework of the fifth phase of the Coupled Model Intercomparison Project (CMIP5). The term "pressure levels" is used to express that the variables were computed at multiple vertical levels, which may differ in number and location among the different models.

calendar_today Interval/period: Sun, 01/01/1860 - Mon, 12/31/2300
This catalogue entry provides monthly climate projections on single levels from a large number of experiments, models, members and time periods computed in the framework of fifth phase of the Coupled Model Intercomparison Project (CMIP5). The term "single levels" is used to express that the variables are computed at one vertical level which can be surface (or a level close to the surface) or a dedicated pressure level in the atmosphere. Multiple vertical levels are excluded from this catalogue entry.

calendar_today Interval/period: Sun, 01/01/1860 - Mon, 12/31/2300
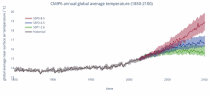
This catalogue entry provides daily and monthly global climate projections data from a large number of experiments, models and time periods computed in the framework of the sixth phase of the Coupled Model Intercomparison Project (CMIP6).
CMIP6 data underpins the Intergovernmental Panel on Climate Change 6th Assessment Report. The use of these data is mostly aimed at:

addressing outstanding scientific questions that arose as part of the IPCC reporting process;
improving the understanding of the climate system;

calendar_today Interval/period: Sun, 01/01/1860 - Mon, 12/31/2300

The DestinE Digital Twin for Climate Change Adaptation (Climate DT) supports adaptation activities by providing innovative climate information on multi-decadal timescales, globally, at scales at which many impacts of climate change are observed. It combines cutting-edge global Earth-system models, impact-sector applications and observations into a unified framework to provide global climate projections and impact-sector information on multi-decadal timescales (1990 to ~2050), at very high spatial resolutions (5 to 10 km).

calendar_today Interval/period: N/A

The DestinE Digital Twin for Climate Change Adaptation (Climate DT) supports adaptation activities by providing innovative climate information on multi-decadal timescales, globally, at scales at which many impacts of climate change are observed. It combines cutting-edge global Earth-system models, impact-sector applications and observations into a unified framework to provide global climate projections and impact-sector information on multi-decadal timescales (1990 to ~2050), at very high spatial resolutions (5 to 10 km).

calendar_today Interval/period: N/A

The DestinE Digital Twin for Climate Change Adaptation (Climate DT) supports adaptation activities by providing innovative climate information on multi-decadal timescales, globally, at scales at which many impacts of climate change are observed. It combines cutting-edge global Earth-system models, impact-sector applications and observations into a unified framework to provide global climate projections and impact-sector information on multi-decadal timescales (1990 to ~2050), at very high spatial resolutions (5 to 10 km).

calendar_today Interval/period: N/A

The DestinE Digital Twin for Climate Change Adaptation (Climate DT) supports adaptation activities by providing innovative climate information on multi-decadal timescales, globally, at scales at which many impacts of climate change are observed. It combines cutting-edge global Earth-system models, impact-sector applications and observations into a unified framework to provide global climate projections and impact-sector information on multi-decadal timescales (1990 to ~2050), at very high spatial resolutions (5 to 10 km).

calendar_today Interval/period: N/A

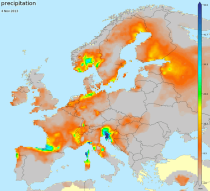
E-OBS is a daily gridded land-only observational dataset over Europe. The blended time series from the station network of the European Climate Assessment & Dataset (ECA&D) project form the basis for the E-OBS gridded dataset. All station data are sourced directly from the European National Meteorological and Hydrological Services (NMHSs) or other data holding institutions.

calendar_today Interval/period: Sun, 01/01/1950 - Tue, 07/07/2026
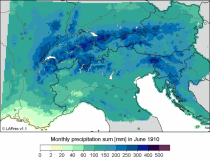
This dataset, also known as the Long-term Alpine Precipitation Reconstruction (LAPrec), provides gridded fields of monthly precipitation for the Alpine region (eight countries). The dataset is derived from station observations and is provided in two issues:

LAPrec1871 starts in 1871 and is based on data from 85 input series;
LAPrec1901 starts in 1901 and is based on data from 165 input series.

calendar_today Interval/period: Sun, 01/01/1871 - Tue, 07/07/2026
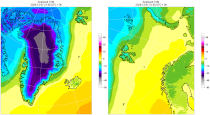
The daily and monthly data of the C3S Arctic Regional Reanalysis (CARRA) dataset contains daily and monthly meteorological variables at 2.5 km resolution. This includes fields at the single levels (including surface) and on pressure, height, soil and model levels.
These daily and monthly data are pre-calculated and have the following types depending on the variables: daily and monthly averages, extremes and totals.

calendar_today Interval/period: Sat, 09/01/1990 - Sat, 02/28/2026
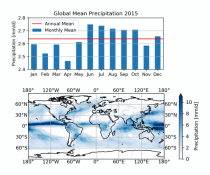
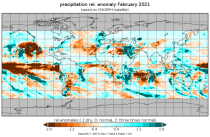
This dataset provides global estimates of daily accumulated and monthly means of precipitation. The precipitation estimates are based on a merge of passive microwave observations from two different radiometer classes operating on multiple Low Earth Orbit (LEO) satellites.

calendar_today Interval/period: Sat, 01/01/2000 - Sun, 12/31/2017
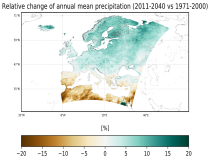
This dataset provides precipitation and near surface air temperature for Europe as Essential Climate Variables (ECVs) and as a set of Climate Impact Indicators (CIIs) based on the ECVs.
ECV datasets provide the empirical evidence needed to understand the current climate and predict future changes.
CIIs contain condensed climate information which facilitate relatively quick and efficient subsequent analysis. Therefore, CIIs make climate information accessible to application focussed users within a sector.

calendar_today Interval/period: N/A

This dataset provides high-resolution gridded temperature and precipitation observations from a selection of sources. Additionally the dataset contains daily global average near-surface temperature anomalies. All fields are defined on either daily or monthly frequency. The datasets are regularly updated to incorporate recent observations. The included data sources are commonly known as GISTEMP, Berkeley Earth, CPC and CPC-CONUS, CHIRPS, IMERG, CMORPH, GPCC and CRU, where the abbreviations are explained below.

calendar_today Interval/period: Thu, 01/01/1750 - Fri, 01/01/2021
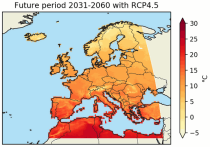
This dataset contains temperature exposure statistics for Europe (e.g. percentiles) derived from the daily 2 metre mean, minimum and maximum air temperature for the entire year, winter (DJF: December-January-February) and summer (JJA: June-July-August). These statistics were derived within the C3S European Health service and are available for different future time periods and using different climate change scenarios.

calendar_today Interval/period: Wed, 01/01/1986 - Mon, 12/31/2085
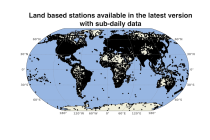
This set of data holdings provides access to data collected from land surface meteorological observations across the globe. Data are available at the observational level and also at daily and monthly aggregations. Data have been collated and harmonised and quality control checks have been performed, but no attempt has been made to assess for potential biases. Data are provided for a range of commonly observed variables.

calendar_today Interval/period: Sat, 01/01/1718 - Thu, 02/26/2026
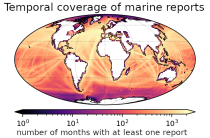
This set of holdings provides access to surface marine meteorological weather reports and observations made by merchant
and naval ships, drifting buoys and other platforms and vessels over
the global ocean. Data have been collated and harmonised and quality control checks have been performed, but no attempt
has been made to assess or correct for potential biases.
Data are provided for a range of commonly observed variables.

calendar_today Interval/period: Tue, 01/01/1850 - Tue, 07/07/2026
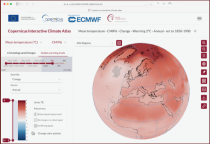
This catalogue entry provides the gridded climate data (monthly/annual timeseries) used for the Copernicus Climate Change Service Atlas (C3S Atlas). The gridded datasets consist of in-situ and satellite observation-based datasets, reanalyses (CERRA, ERA5, ERA5-Land, and ORAS5) and global (CMIP5 and CMIP6) and regional (CORDEX) climate projections for the variables and indices included in the C3S Atlas.

calendar_today Interval/period: Sun, 01/01/1860 - Mon, 12/31/2300
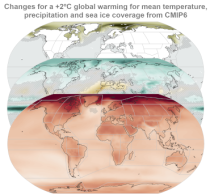
This catalogue entry provides gridded data from global (CMIP5 and CMIP6) and regional (CORDEX) projections for the set of 22 variables and indices included in the IPCC Interactive Atlas, a novel contribution from Working Group I (WGI) to the IPCC Sixth Assessment Report (AR6). These variables and indices are relevant for the climatic impact-drivers used in the regional assessments conducted in AR6 (Chapters 10, 11, 12 and Atlas), related to heat and cold, wet and dry, snow and ice, and wind.

calendar_today Interval/period: Sun, 01/01/1860 - Mon, 12/31/2300
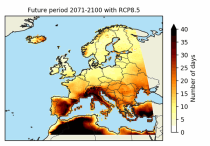
The dataset contains the number of hot and cold spell days using different European-wide and national/regional definitions developed within the C3S European Health service.
These heat wave and cold spell days are available for different future time periods and use different climate change scenarios.

calendar_today Interval/period: Wed, 01/01/1986 - Mon, 12/31/2085
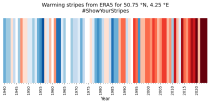
ERA5 is the fifth generation ECMWF reanalysis for the global climate and weather for the past 8 decades.
Data is available from 1940 onwards. ERA5 replaces the ERA-Interim reanalysis.

calendar_today Interval/period: Mon, 01/01/1940 - Fri, 12/06/2024
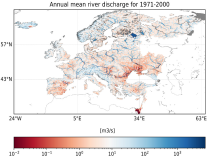
This dataset provides water variables and indicators based on hydrological impact modelling, forced by bias adjusted regional climate simulations from the European Coordinated Regional Climate Downscaling Experiment (EURO-CORDEX). The dataset contains Essential Climate Variable (ECV) data in the form of daily mean river discharge and a set of climate impact indicators (CIIs) for both water quantity and quality.
ECV datasets provide the empirical evidence needed to understand the current climate and predict future changes.

calendar_today Interval/period: N/A

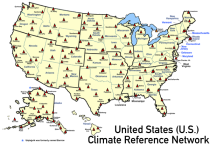
This catalogue entry provides access to a continuous series of near-surface climate observations collected in-situ at
United States Climate Reference Network (USCRN) stations.
There are over 130 USCRN stations over the conterminous United States (U.S.), Alaska, and Hawaii.
The USCRN stations are managed and maintained by the U.S. National Oceanic and Atmospheric Administration (NOAA).
The USCRN observations include air temperature, humidity, wind speed, precipitation, solar radiation,

calendar_today Interval/period: Sun, 01/01/2006 - Tue, 07/07/2026
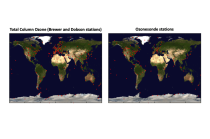
This dataset provides access to two types of ozone observations: total column ozone estimates and vertical profiles of ozone concentration.
The total ozone estimates are based on solar UV radiation measurements made by ground-based spectrophotometers (Dobson or Brewer type spectrophotometers).
The vertical profiles of ozone concentration are estimated primarily using ozonesonde observations.
Data are available for 159 Dobson stations, 109 Brewer stations and 135 ozonesondes stations.

calendar_today Interval/period: Tue, 01/01/1924 - Tue, 07/07/2026