Datasets
Interval/period: Mon, 01/01/1951 - Sun, 07/05/2026
Interval/period: Sun, 01/01/1860 - Mon, 12/31/2300
Interval/period: Sat, 01/01/1949 - Sun, 07/05/2026
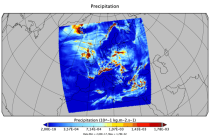
Interval/period: Thu, 10/18/2018 - Wed, 07/31/2019
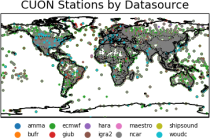
to contain all available observations from balloons ascents through the atmosphere.
The main geophysical variables are temperature, humidity, and wind speed and wind direction,
as functions of atmospheric pressure levels. The observation platforms include pilot balloons, radiosondes, and ozonesondes.
The main observation data sources are:
- the NOAA Integrated Global Radiosonde Archive (IGRA version 2),
- the NCAR Upper-Air Database (UADB), and
Interval/period: Tue, 01/01/1901 - Tue, 12/31/2024
Interval/period: Sun, 01/01/1950 - Fri, 12/31/2100
Interval/period: N/A
Interval/period: Mon, 01/01/1940 - Fri, 12/31/2100
Interval/period: N/A
Interval/period: Mon, 01/01/1979 - Mon, 06/30/2025
Interval/period: Sun, 01/01/1860 - Mon, 12/31/2300
Interval/period: Wed, 01/01/1800 - Fri, 12/31/2100
Interval/period: Sun, 01/01/1860 - Mon, 12/31/2300
Interval/period: Sun, 01/01/1860 - Mon, 12/31/2300
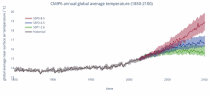
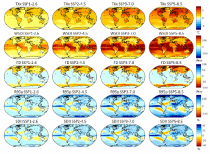
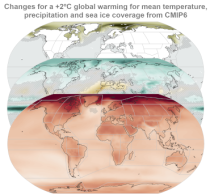
CMIP6 data underpins the Intergovernmental Panel on Climate Change 6th Assessment Report. The use of these data is mostly aimed at:
addressing outstanding scientific questions that arose as part of the IPCC reporting process;
improving the understanding of the climate system;
Interval/period: Sun, 01/01/1860 - Mon, 12/31/2300
Interval/period: Sun, 01/01/1950 - Thu, 12/31/2099
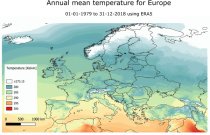
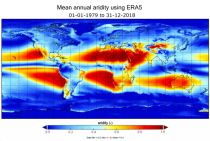
Interval/period: Mon, 01/01/1979 - Mon, 12/31/2018
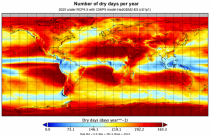
These daily and monthly data are pre-calculated and have the following types depending on the variables: daily and monthly averages, extremes and totals.
Interval/period: Sat, 09/01/1990 - Sat, 02/28/2026
Interval/period: Sun, 01/01/1950 - Thu, 12/31/2099
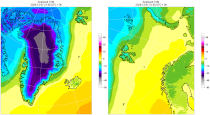
Interval/period: Mon, 01/01/1979 - Mon, 12/31/2018
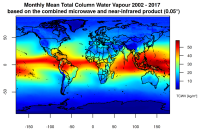
This catalogue entry presents two extensive, high-quality observational datasets of TCWV, specifically tailored for climate analysis and applications.
Interval/period: Tue, 01/01/2002 - Sun, 12/31/2017
Interval/period: Sun, 01/01/1860 - Mon, 12/31/2300
Interval/period: Sun, 01/01/1860 - Mon, 12/31/2300
Data is available from 1940 onwards. ERA5 replaces the ERA-Interim reanalysis.
Interval/period: Mon, 01/01/1940 - Fri, 12/06/2024
Fifth Generation of the European Centre for Medium-Range Weather Forecasts (ECMWF) Reanalysis (ERA5).
Produced by replaying only the land component of the ECMWF ERA5 climate reanalysis, it benefits from the same physical data-assimilation framework but runs offline at
higher spatial detail (9 km grid) to deliver richer land-surface information.
Interval/period: Sun, 01/01/1950 - Thu, 12/31/2026