Datasets

The DestinE Digital Twin for Climate Change Adaptation (Climate DT) supports adaptation activities by providing innovative climate information on multi-decadal timescales, globally, at scales at which many impacts of climate change are observed. It combines cutting-edge global Earth-system models, impact-sector applications and observations into a unified framework to provide global climate projections and impact-sector information on multi-decadal timescales (1990 to ~2050), at very high spatial resolutions (5 to 10 km).
Interval/period: N/A

This chart shows the probability that both the wind at 10 m above the earth's surface is ...
Interval/period: N/A

The ECMWF seasonal forecasts (SEAS5) are produced every month with a 51-member ensemble at a ...
Interval/period: N/A

This chart provides information on the verification of forecasts of the number of tropical ...
Interval/period: N/A
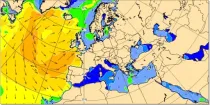
At any location over the oceans, there is a spectrum of waves which describes how much wave energy is present for given wave frequencies and direction of propagation...
Interval/period: N/A
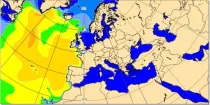
Significant wave height can be shown to correspond to the average wave height of the top one-third highest waves. The wave period of windsea is generally <10s,...
Interval/period: N/A
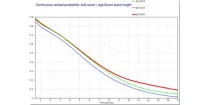
These diagrams compare Continuous Ranked Probability Skill Scores (CRPSS) of ECMWF with ...
Interval/period: N/A