Datasets

This chart provides information on the verification of forecasts of Accumulated Cyclone Energy ...
Interval/period: N/A

The ECMWF seasonal forecasts (SEAS5) are produced every month with a 51-member ensemble at a ...
Interval/period: N/A
Interval/period: Sun, 01/01/1978 - Wed, 10/17/2018
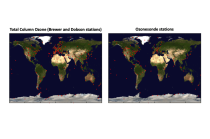
The total ozone estimates are based on solar UV radiation measurements made by ground-based spectrophotometers (Dobson or Brewer type spectrophotometers).
The vertical profiles of ozone concentration are estimated primarily using ozonesonde observations.
Data are available for 159 Dobson stations, 109 Brewer stations and 135 ozonesondes stations.
Interval/period: Tue, 01/01/1924 - Sat, 05/09/2026
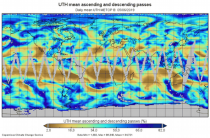
(GNSS) radio signals.
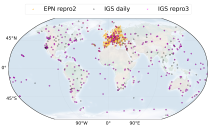
The initial data is collected from two in situ ground-based network of GNSS receivers – the International GNSS Service
(IGS) and EUREF Permanent Network (EPN). The IGS collects, archives, and freely distributes GNSS data from a
cooperatively operated global network of more than 500 ground-based GNSS stations since 1994. The EPN is a European
Interval/period: Mon, 01/01/1996 - Sat, 05/09/2026
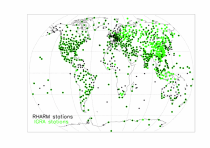
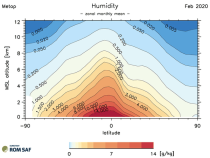
The first is version 2 of the Integrated Global Radiosounding Archive (IGRA) from 1978 which incorporates global
radiosounding profiles of temperature, humidity and wind from a large number of data sources,
which is 30% larger than the previous version 1. IGRA v2 is the result of quality assurance procedures applied to the
Interval/period: Sun, 01/01/1978 - Sat, 05/09/2026
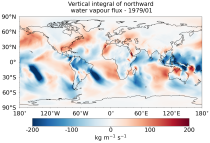
The vertically integrated budget diagnostics include the tendencies and lateral fluxes of total energy, water vapour, and latent heat (with the latent heat of vaporization varying with temperature). In addition, the divergences of the lateral fluxes are provided.
Interval/period: Mon, 01/01/1979 - Sat, 05/09/2026

Mean wave period is the spectrally averaged period of the waves. Wave periods are shown in seconds using colour shading – click on the middle icon to the bottom right for the scale...
Interval/period: N/A
Interval/period: Wed, 01/01/1986 - Sun, 12/31/2023
Interval/period: Wed, 01/01/1986 - Sun, 12/31/2023

This chart shows probability information regarding mean wave period derived from the ECMWF ...
Interval/period: N/A

This chart shows probability information regarding significant wave height derived from the ...
Interval/period: N/A

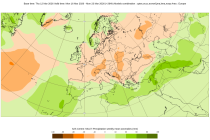
These charts show the probability of various mean periods of ocean waves 10-15 days ahead. The ...
Interval/period: N/A

The ECMWF seasonal forecasts (SEAS5) are produced every month with a 51-member ensemble at a ...
Interval/period: N/A
Interval/period: Fri, 12/01/2006 - Mon, 12/01/2025
Interval/period: Thu, 10/18/2018 - Wed, 07/31/2019
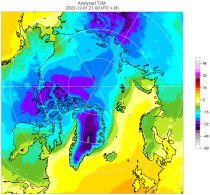
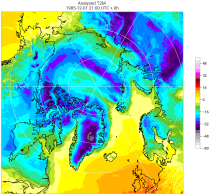
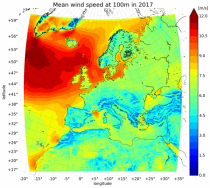
It has been generated using the UERRA-HARMONIE system by combining model data with observations into a complete and consistent dataset using the laws of physics.
Interval/period: Thu, 10/18/2018 - Wed, 07/31/2019
UERRA-HARMONIE and MESCAN-SURFEX systems. Forecasts up to 30 hours initialised
from the analyses at 00 and 12 UTC are available only through the CDS-API (see Documentation).
UERRA-HARMONIE is a 3-dimensional variational data assimilation system,
while MESCAN-SURFEX is a complementary surface analysis system.
Using the Optimal Interpolation method, MESCAN provides the best estimate of daily accumulated precipitation
Interval/period: Thu, 10/18/2018 - Wed, 07/31/2019
Interval/period: Tue, 07/05/1994 - Sun, 02/28/2021

Mean windsea wave direction is the spectrally averaged direction of propagation of the windsea waves (weighted by wave height). Arrow length is proportional to the speed of wave propagation...
Interval/period: N/A

Significant windsea wave height can be shown to correspond to the average wave height of the top one-third highest windsea waves. Wave heights are shown in metres using colour shading...
Interval/period: N/A
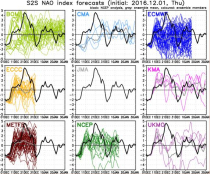
S2S project behind the dataset started in 2013 as a joint initiative of the World Weather Research Programme (WWRP) and the World Climate Research Programme (WCRP).
The goal of S2S project was to improve sub-seasonal forecast skill through combining multiple forecasting systems, enable multi-model evaluations and enhance knowledge sharing between operational centres.
Interval/period: Thu, 01/01/2015 - Wed, 05/06/2026
S2S project behind the dataset started in 2013 as a joint initiative of the World Weather Research Programme (WWRP) and the World Climate Research Programme (WCRP).
The goal of S2S project was to improve sub-seasonal forecast skill through combining multiple forecasting systems, enable multi-model evaluations and enhance knowledge sharing between operational centres.
Interval/period: Tue, 03/01/2011 - Tue, 06/09/2026

These charts show probability of various heights of significant waves 10-15 days ahead. The ...
Interval/period: N/A

Mean total swell wave direction is the spectrally averaged propagation direction of the swell waves (weighted by wave height) of the part of the spectrum that is NOT windsea...
Interval/period: N/A