Datasets

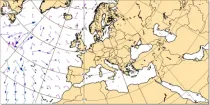
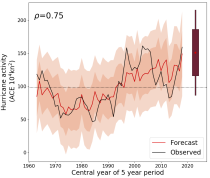
This chart provides information on the verification of forecasts of Accumulated Cyclone Energy ...
Interval/period: N/A

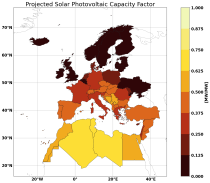
The ECMWF seasonal forecasts (SEAS5) are produced every month with a 51-member ensemble at a ...
Interval/period: N/A
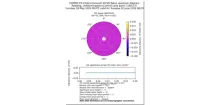
The idea of the plot is to be able to display each spectral partition as an arrow, with the direction being the mean direction, the length of the arrow the significant wave height, the colour of the arrow the mean wave period with the different arrow head for each partitions.
Interval/period: N/A
**These are experimental products and subject to change based on user feedback** These ...
Interval/period: N/A
Interval/period: Sat, 09/01/1984 - Thu, 07/31/2025
Interval/period: N/A
Interval/period: Sun, 01/01/1950 - Wed, 12/01/2100
Interval/period: Sun, 01/01/1860 - Mon, 12/31/2300

This chart shows the probability that both the wind at 10 m above the earth's surface is ...
Interval/period: N/A
Interval/period: Sat, 01/01/1949 - Sun, 07/05/2026
Interval/period: Sun, 01/01/1950 - Fri, 12/31/2100
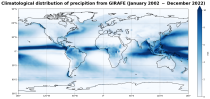
Interval/period: Tue, 01/01/2002 - Sat, 12/31/2022
Interval/period: Mon, 01/01/1940 - Fri, 12/31/2100
Interval/period: Sun, 01/01/1860 - Mon, 12/31/2300
Interval/period: Wed, 01/01/1800 - Fri, 12/31/2100
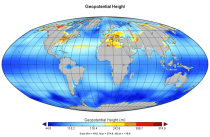
Interval/period: Sun, 01/01/1860 - Mon, 12/31/2300
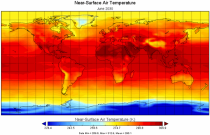
Interval/period: Sun, 01/01/1860 - Mon, 12/31/2300
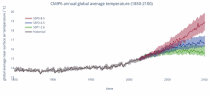
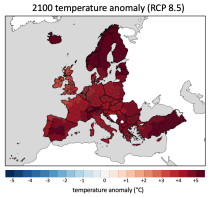
CMIP6 data underpins the Intergovernmental Panel on Climate Change 6th Assessment Report. The use of these data is mostly aimed at:
addressing outstanding scientific questions that arose as part of the IPCC reporting process;
improving the understanding of the climate system;
Interval/period: Sun, 01/01/1860 - Mon, 12/31/2300
Interval/period: Sun, 01/01/1950 - Sun, 07/05/2026
Significant wave height can be shown to correspond to the average wave height of the top one-third highest waves. The wave period of windsea is generally <10s,...
Interval/period: N/A
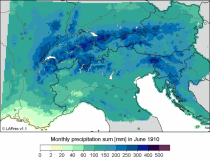
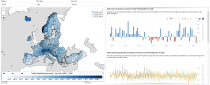
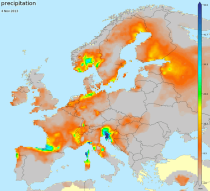
LAPrec1871 starts in 1871 and is based on data from 85 input series;
LAPrec1901 starts in 1901 and is based on data from 165 input series.
Interval/period: Sun, 01/01/1871 - Sun, 07/05/2026
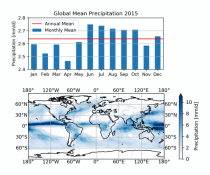
These daily and monthly data are pre-calculated and have the following types depending on the variables: daily and monthly averages, extremes and totals.
Interval/period: Sat, 09/01/1990 - Sat, 02/28/2026
Interval/period: Sat, 01/01/2000 - Sun, 12/31/2017

This chart shows probability information regarding mean wave period derived from the ECMWF ...
Interval/period: N/A

This chart shows probability information regarding significant wave height derived from the ...
Interval/period: N/A