Datasets

This chart provides information on the verification of forecasts of Accumulated Cyclone Energy ...
Interval/period: N/A

The ECMWF seasonal forecasts (SEAS5) are produced every month with a 51-member ensemble at a ...
Interval/period: N/A

These charts show indices which indicate the susceptibility of the troposphere to support free convection. Typical values of the different indices depend on location and...
Interval/period: N/A
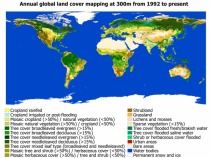
Interval/period: Wed, 01/01/1992 - Sat, 01/01/2022
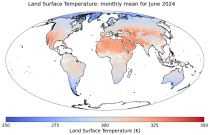
Interval/period: Thu, 06/01/1995 - Tue, 12/31/2024
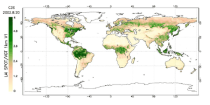
Interval/period: Tue, 09/01/1981 - Sun, 12/01/2024

This diagram shows time evolution of a Madden-Julian Oscillation (MJO) index. ...
Interval/period: N/A

Mean wave period is the spectrally averaged period of the waves. Wave periods are shown in seconds using colour shading – click on the middle icon to the bottom right for the scale...
Interval/period: N/A
Interval/period: Mon, 01/01/2001 - Fri, 04/01/2022
Interval/period: N/A
Interval/period: Wed, 01/03/1940 - Tue, 05/05/2026
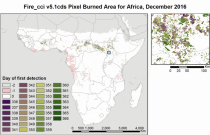
Fire radiative power and active fire pixels from 2020 to present derived from satellite observations
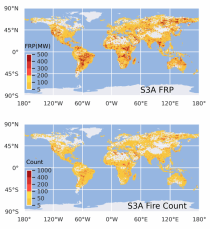
Interval/period: Wed, 01/01/2020 - Fri, 02/28/2025
Interval/period: Mon, 01/01/1951 - Wed, 05/13/2026
Interval/period: Mon, 01/01/1979 - Thu, 04/30/2026

This chart shows probability information regarding lightning flash density derived from the ...
Interval/period: N/A

This chart shows probability information regarding mean wave period derived from the ECMWF ...
Interval/period: N/A

This chart shows probability information regarding significant wave height derived from the ...
Interval/period: N/A

These charts show the probability of various mean periods of ocean waves 10-15 days ahead. The ...
Interval/period: N/A

The ECMWF seasonal forecasts (SEAS5) are produced every month with a 51-member ensemble at a ...
Interval/period: N/A

Mean windsea wave direction is the spectrally averaged direction of propagation of the windsea waves (weighted by wave height). Arrow length is proportional to the speed of wave propagation...
Interval/period: N/A

Significant windsea wave height can be shown to correspond to the average wave height of the top one-third highest windsea waves. Wave heights are shown in metres using colour shading...
Interval/period: N/A

These charts show probability of various heights of significant waves 10-15 days ahead. The ...
Interval/period: N/A

This chart shows probability information regarding CAPE shear derived from the ECMWF ensemble ...
Interval/period: N/A

This chart shows probability information regarding MUCAPE derived from the ECMWF ensemble (ENS) ...
Interval/period: N/A

Mean total swell wave direction is the spectrally averaged propagation direction of the swell waves (weighted by wave height) of the part of the spectrum that is NOT windsea...
Interval/period: N/A