Datasets

This chart provides information on the verification of forecasts of Accumulated Cyclone Energy ...
Interval/period: N/A

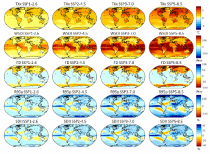
The ECMWF seasonal forecasts (SEAS5) are produced every month with a 51-member ensemble at a ...
Interval/period: N/A
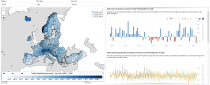
Interval/period: Mon, 01/01/1951 - Sat, 07/04/2026
The idea of the plot is to be able to display each spectral partition as an arrow, with the direction being the mean direction, the length of the arrow the significant wave height, the colour of the arrow the mean wave period with the different arrow head for each partitions.
Interval/period: N/A
**These are experimental products and subject to change based on user feedback** These ...
Interval/period: N/A

This chart shows the probability that both the wind at 10 m above the earth's surface is ...
Interval/period: N/A
Interval/period: N/A
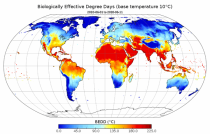
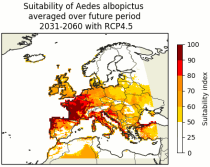
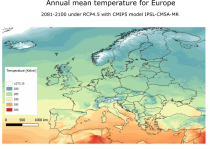
Interval/period: Mon, 01/01/1940 - Fri, 12/31/2100
Interval/period: N/A
Interval/period: Sun, 01/01/1950 - Thu, 12/31/2099
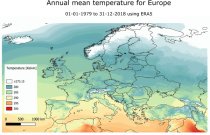
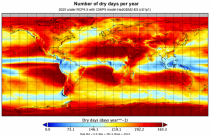
Interval/period: Mon, 01/01/1979 - Mon, 12/31/2018
Significant wave height can be shown to correspond to the average wave height of the top one-third highest waves. The wave period of windsea is generally <10s,...
Interval/period: N/A

This chart shows probability information regarding mean wave period derived from the ECMWF ...
Interval/period: N/A

This chart shows probability information regarding significant wave height derived from the ...
Interval/period: N/A

These charts show the probability of various mean periods of ocean waves 10-15 days ahead. The ...
Interval/period: N/A

These charts show probability of various heights of significant waves 10-15 days ahead. The ...
Interval/period: N/A

Significant wave height can be shown to correspond to the average wave height of the top one-third highest waves. The wave period of windsea is generally <10s,...
Interval/period: N/A

Mean wave period is the spectrally averaged period of the waves. Wave periods are shown in seconds using colour shading – click on the middle icon to the bottom right for the scale...
Interval/period: N/A
Interval/period: Sun, 01/01/1950 - Thu, 12/31/2099
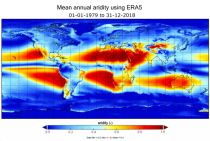
Interval/period: Mon, 01/01/1979 - Mon, 12/31/2018
These charts show areas where anomalous significant wave heights are likely to occur. These charts are based on the ECMWF ense ...
Interval/period: N/A
Fifth Generation of the European Centre for Medium-Range Weather Forecasts (ECMWF) Reanalysis (ERA5).
Produced by replaying only the land component of the ECMWF ERA5 climate reanalysis, it benefits from the same physical data-assimilation framework but runs offline at
higher spatial detail (9 km grid) to deliver richer land-surface information.
Interval/period: Sun, 01/01/1950 - Thu, 12/31/2026
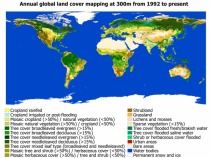
Interval/period: Wed, 01/01/1992 - Sat, 01/01/2022
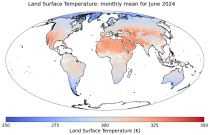
Interval/period: Thu, 06/01/1995 - Tue, 12/31/2024
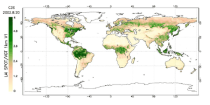
Interval/period: Tue, 09/01/1981 - Sun, 12/01/2024