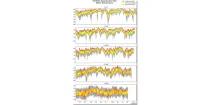
These diagrams compare scores of ensemble control (red) and ensemble members (central 50% of ...
calendar_today Interval/period: N/A
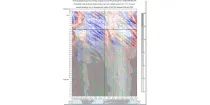
This is a time/longitude diagram (Hovmoller diagram) of 500 hPa or 1000 hPa mean height anomaly ...