Datasets
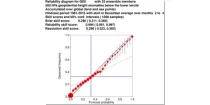
The reliability diagram shows the reliability of the ECMWF seasonal forecast system (SEAS5) with ...
Interval/period: N/A
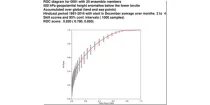
This chart shows the Relative Operating Characteristics (ROC) diagram for the three-month ...
Interval/period: N/A
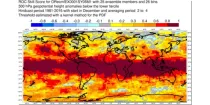
This chart shows the spatial variation in the Relative Operating Characteristics (ROC) skill ...
Interval/period: N/A

The ECMWF seasonal forecasts (SEAS5) are produced every month with a 51-member ensemble at a ...
Interval/period: N/A

The 850 hPa level is usually just above the boundary layer and at this level the day-night variation in temperature is generally negligible...
Interval/period: N/A

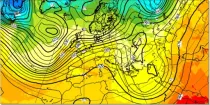
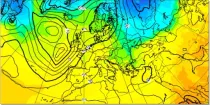
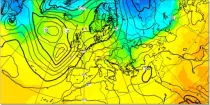
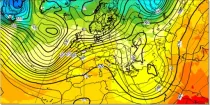
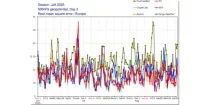
This chart shows 7-day mean anomalies of 500hPa geopotential height from the ECMWF Sub-seasonal ...
Interval/period: N/A

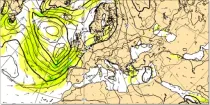
500-1000 hPa thickness is a measure of the mean temperature of a column of the atmosphere between these pressure levels and can be used to distinguish between warm and cold air masses and...
Interval/period: N/A
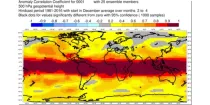
This chart shows the spatial variation in the Anomaly Correlation Coefficient (ACC) for the ...
Interval/period: N/A
Aurora: a deep learning-based system developed by Microsoft. It is initialised with ECMWF analysis. Aurora operates at 0.1° resolution.
Interval/period: N/A
Aurora: a deep learning-based system developed by Microsoft. It is initialised with ECMWF analysis. Aurora operates at 0.1° resolution.
Interval/period: N/A
Aurora: a deep learning-based system developed by Microsoft. It is initialised with ECMWF analysis. Aurora operates at 0.1° resolution.
Interval/period: N/A

FourCastNet v2-small:a deep learning-based system developed by NVIDIA in collaboration with researchers at several US universities.It is initialised with ECMWF analysis. FourCastNet operates at 0.25° resolution.
Interval/period: N/A
FourCastNet v2-small:a deep learning-based system developed by NVIDIA in collaboration with researchers at several US universities.It is initialised with ECMWF analysis. FourCastNet operates at 0.25° resolution.
Interval/period: N/A

FourCastNet v2-small:a deep learning-based system developed by NVIDIA in collaboration with researchers at several US universities.It is initialised with ECMWF analysis. FourCastNet operates at 0.25° resolution.
Interval/period: N/A
GraphCast (Google DeepMind): a deep learning-based system developed by Google DeepMind.It is initialised with ECMWF analysis. GraphCast operates at 0.25° resolution.
Interval/period: N/A

Interval/period: Wed, 01/01/2003 - Sun, 12/31/2017
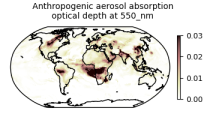
This dataset provides aerosol optical depths and aerosol-radiation radiative effects for four different aerosol origins: anthropogenic, mineral dust, marine, and land-based fine-mode natural aerosol. The latter mostly consists of biogenic aerosols.
Interval/period: N/A

carbon dioxide
methane
tropospheric ozone
stratospheric ozone
interactions between anthropogenic aerosols and radiation
interactions between anthropogenic aerosols and clouds
Interval/period: Wed, 01/01/2003 - Sun, 12/31/2017
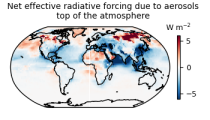
This dataset provides geographical distributions of the radiative forcing (RF) by key atmospheric constituents. The radiative forcing estimates are based on the CAMS reanalysis and additional model simulations and are provided separately for...
- carbon dioxide
- methane
- tropospheric ozone
- stratospheric ozone
- interactions between anthropogenic aerosols and radiation
Interval/period: N/A
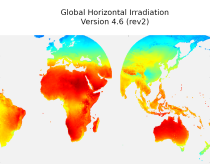
irradiation, as well as direct normal irradiation, on a latitude/longitude grid
covering land surfaces and coastal areas of Europe, Africa, Oceania, Eastern
South America, the Middle East and South-East Asia. It is created from 15 minute
resolved timeseries at each grid point. These timeseries were calculated by the
CAMS Solar Radiation Time Series Service and use information on aerosol, ozone
Interval/period: Sat, 01/01/2005 - Sun, 12/31/2023
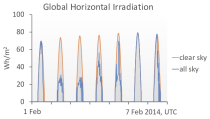
The CAMS solar radiation services provide historical values (2004 to present) of global (GHI), direct (BHI) and diffuse (DHI) solar irradiation, as well as direct normal irradiation (BNI). The aim is to fulfil the needs of European and national policy development and the requirements of both commercial and public downstream services, e.g. for planning, monitoring, efficiency improvements and the integration of solar energy systems into energy supply grids.
Interval/period: N/A
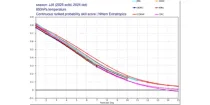
These diagrams compare Continuous Ranked Probability Skill Scores (CRPSS) of ECMWF with ...
Interval/period: N/A
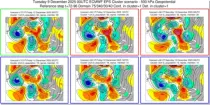
These charts show clustering of ENS members based on the 500 hPa height forecasts. ...
Interval/period: N/A
**Note:** In **June 2023** ECMWF implemented a **major upgrade ...**
Interval/period: N/A
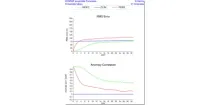
These plots compare recent IFS and experimental AIFS daily verification scores for 500 hPa ...
Interval/period: N/A