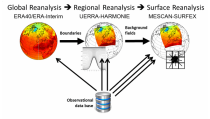
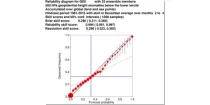
The reliability diagram shows the reliability of the ECMWF seasonal forecast system (SEAS5) with ...

calendar_today Interval/period: N/A

open_in_newview in Open Charts

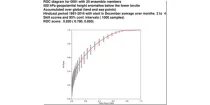
This chart shows the Relative Operating Characteristics (ROC) diagram for the three-month ...

calendar_today Interval/period: N/A

open_in_newview in Open Charts

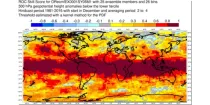
This chart shows the spatial variation in the Relative Operating Characteristics (ROC) skill ...

calendar_today Interval/period: N/A

open_in_newview in Open Charts

The ECMWF seasonal forecasts (SEAS5) are produced every month with a 51-member ensemble at a ...

calendar_today Interval/period: N/A

open_in_newview in Open Charts

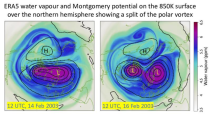
The 850 hPa level is usually just above the boundary layer and at this level the day-night variation in temperature is generally negligible...

calendar_today Interval/period: N/A

open_in_newview in Open Charts

This chart shows 7-day mean anomalies of 500hPa geopotential height from the ECMWF Sub-seasonal ...

calendar_today Interval/period: N/A

open_in_newview in Open Charts

500-1000 hPa thickness is a measure of the mean temperature of a column of the atmosphere between these pressure levels and can be used to distinguish between warm and cold air masses and...

calendar_today Interval/period: N/A

open_in_newview in Open Charts

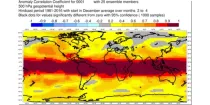
This chart shows the spatial variation in the Anomaly Correlation Coefficient (ACC) for the ...

calendar_today Interval/period: N/A

open_in_newview in Open Charts

Aurora: a deep learning-based system developed by Microsoft. It is initialised with ECMWF analysis. Aurora operates at 0.1° resolution.

calendar_today Interval/period: N/A

open_in_newview in Open Charts

Aurora: a deep learning-based system developed by Microsoft. It is initialised with ECMWF analysis. Aurora operates at 0.1° resolution.

calendar_today Interval/period: N/A

open_in_newview in Open Charts

Aurora: a deep learning-based system developed by Microsoft. It is initialised with ECMWF analysis. Aurora operates at 0.1° resolution.

calendar_today Interval/period: N/A

open_in_newview in Open Charts

FourCastNet v2-small:a deep learning-based system developed by NVIDIA in collaboration with researchers at several US universities.It is initialised with ECMWF analysis. FourCastNet operates at 0.25° resolution.

calendar_today Interval/period: N/A

open_in_newview in Open Charts

FourCastNet v2-small:a deep learning-based system developed by NVIDIA in collaboration with researchers at several US universities.It is initialised with ECMWF analysis. FourCastNet operates at 0.25° resolution.

calendar_today Interval/period: N/A

open_in_newview in Open Charts

FourCastNet v2-small:a deep learning-based system developed by NVIDIA in collaboration with researchers at several US universities.It is initialised with ECMWF analysis. FourCastNet operates at 0.25° resolution.

calendar_today Interval/period: N/A

open_in_newview in Open Charts

GraphCast (Google DeepMind): a deep learning-based system developed by Google DeepMind.It is initialised with ECMWF analysis. GraphCast operates at 0.25° resolution.

calendar_today Interval/period: N/A

open_in_newview in Open Charts
This catalogue entry provides daily and monthly global climate model data from Decadal Climate Predictions Project (DCPP) experiments, part of the sixth phase of the Coupled Model Intercomparison Project (CMIP6). The decadal data in the Climate Data Store (CDS) are a quality-controlled subset of the full DCPP.

calendar_today Interval/period: Sun, 01/01/1860 - Mon, 12/31/2300

ERA5 is the fifth generation ECMWF atmospheric reanalysis of the global climate covering the period from January 1940 to present. It is produced by the Copernicus Climate Change Service (C3S) at ECMWF and provides hourly estimates of a large number of atmospheric, land and oceanic climate variables. The data cover the Earth on a 31km grid and resolve the atmosphere using 137 levels from the surface up to a height of 80km. ERA5 includes an ensemble component at half the resolution to provide information on synoptic uncertainty of its products.

calendar_today Interval/period: Sat, 01/01/1949 - Sat, 07/04/2026

The UERRA datasets contain reanalysis data of the atmosphere, the surface and near-surface as well as for the soil covering Europe. Essential climate variables are generated with the UERRA-HARMONIE and the MESCAN-SURFEX systems. UERRA-HARMONIE is a 3-dimensional variational data assimilation system, while MESCAN-SURFEX is a complementary surface analysis system.

calendar_today Interval/period: Thu, 10/18/2018 - Wed, 07/31/2019

The Comprehensive Upper-air Observation Network (CUON) dataset is designed
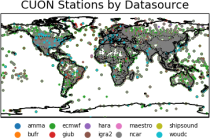
to contain all available observations from balloons ascents through the atmosphere.
The main geophysical variables are temperature, humidity, and wind speed and wind direction,
as functions of atmospheric pressure levels. The observation platforms include pilot balloons, radiosondes, and ozonesondes.
The main observation data sources are:
- the NOAA Integrated Global Radiosonde Archive (IGRA version 2),
- the NCAR Upper-Air Database (UADB), and

calendar_today Interval/period: Tue, 01/01/1901 - Tue, 12/31/2024

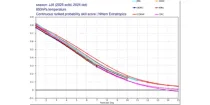
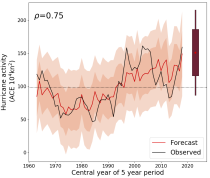
These diagrams compare Continuous Ranked Probability Skill Scores (CRPSS) of ECMWF with ...

calendar_today Interval/period: N/A

open_in_newview in Open Charts
This catalogue entry provides Regional Climate Model (RCM) data on single levels from a number of experiments, models, domains, resolutions, ensemble members, time frequencies and periods computed over several regional domains all over the World in the framework of the Coordinated Regional Climate Downscaling Experiment (CORDEX). The term "single levels" is used to express that the variables are 2D-matrices computed on one vertical level which can be surface (or a level close to the surface) or a dedicated pressure level in the atmosphere.

calendar_today Interval/period: Sun, 01/01/1950 - Fri, 12/31/2100

Cloud properties directly influence the state of the Earth´s upper-air atmosphere. Clouds have an effect on weather and climate through their contribution to the Earth’s water cycle and impact on the Earth’s energy budget. They impact atmospheric motions on a range of spatial and temporal scales and contribute to changes in the atmospheric composition.

calendar_today Interval/period: Mon, 01/01/1979 - Mon, 06/30/2025

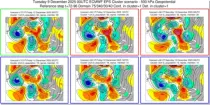
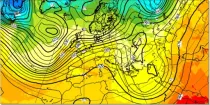
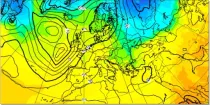
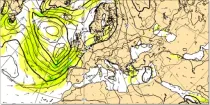
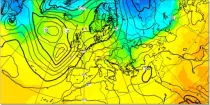
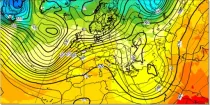
These charts show clustering of ENS members based on the 500 hPa height forecasts. ...

calendar_today Interval/period: N/A

open_in_newview in Open Charts
This catalogue entry provides daily climate projections on pressure levels from a large number of experiments, models, members and time periods computed in the framework of fifth phase of the Coupled Model Intercomparison Project (CMIP5). The term "pressure levels" is used to express that the variables were computed at multiple vertical levels, which may differ in number and location among the different models.

calendar_today Interval/period: Sun, 01/01/1860 - Mon, 12/31/2300

This catalogue entry provides daily climate projections on single levels from a large number of experiments, models, members and time periods computed in the framework of the fifth phase of the Coupled Model Intercomparison Project (CMIP5). The term "single levels" is used to express that the variables are computed at one vertical level which can be surface (or a level close to the surface) or a dedicated pressure level in the atmosphere. Multiple vertical levels are excluded from this catalogue entry.

calendar_today Interval/period: Wed, 01/01/1800 - Fri, 12/31/2100