Datasets
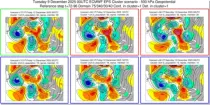
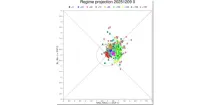
These charts show clustering of ENS members based on the 500 hPa height forecasts. ...
Interval/period: N/A
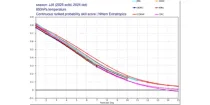
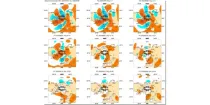
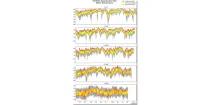
These diagrams compare Continuous Ranked Probability Skill Scores (CRPSS) of ECMWF with ...
Interval/period: N/A
**Note:** In **June 2023** ECMWF implemented a **major upgrade ...**
Interval/period: N/A
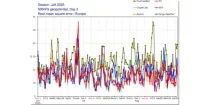
These plots compare recent IFS and experimental AIFS daily verification scores for 500 hPa ...
Interval/period: N/A
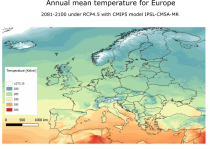
Interval/period: Sun, 01/01/1950 - Thu, 12/31/2099
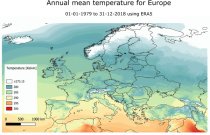
Interval/period: Mon, 01/01/1979 - Mon, 12/31/2018
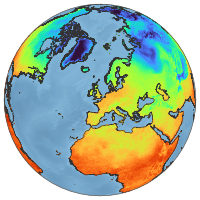
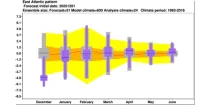
These charts show the mean and variation in the latest ECMWF ensemble forecast (ENS). ...
Interval/period: N/A
These charts show the mean and variation in the latest ECMWF ensemble forecast (ENS). ...
Interval/period: N/A

These charts show the mean and variation in the latest ECMWF ensemble forecast (ENS). ...
Interval/period: N/A
These diagrams aim to show the time evolution of regimes which are indicative of the likely weather in and around Europe.The winds across the Atlantic can usefully be classified into four regimes ...
Interval/period: N/A
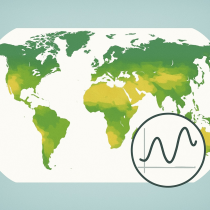
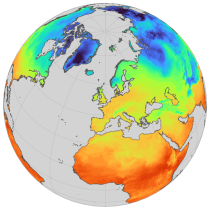
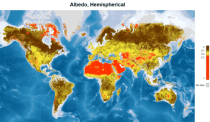
Fifth Generation of the European Centre for Medium-Range Weather Forecasts (ECMWF) Reanalysis (ERA5).
Produced by replaying only the land component of the ECMWF ERA5 climate reanalysis, it benefits from the same physical data-assimilation framework but runs offline at
higher spatial detail (9 km grid) to deliver richer land-surface information.
Interval/period: Sun, 01/01/1950 - Thu, 12/31/2026
Interval/period: Sun, 01/01/1950 - Sat, 05/02/2026
Interval/period: Sun, 01/01/1950 - Wed, 04/01/2026
Interval/period: Sun, 01/01/1950 - Sat, 05/02/2026
Interval/period: Sun, 01/01/1950 - Thu, 12/31/2099
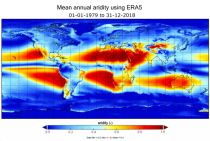
Interval/period: Mon, 01/01/1979 - Mon, 12/31/2018
This chart shows 7-day mean anomalies for a range of parameters from the ECMWF Sub-seasonal ...
Interval/period: N/A
**Note:** In **June 2023** ECMWF implemented a **major upgrade ...**
Interval/period: N/A
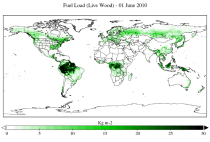
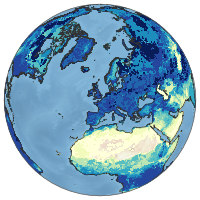
The two main variable groups are fuel load and fuel moisture, both of which are further divided by live/dead and wood/foliage fractions.
The dataset combines state-of-the-art model data (ERA5-Land) with observations from multiple satellites and in-situ variables into a globally complete and consistent dataset.
Interval/period: Wed, 01/01/2003 - Fri, 12/31/2021
Interval/period: Sun, 02/01/1981 - Wed, 04/01/2026
Interval/period: Tue, 09/01/1981 - Sun, 12/01/2024
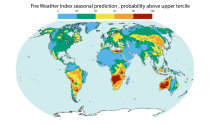
The ECMWF seasonal forecasts (SEAS5) are produced every month with a 51-member ensemble at a ...
Interval/period: N/A
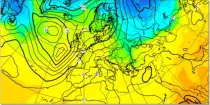
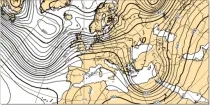
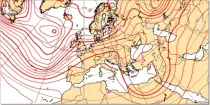
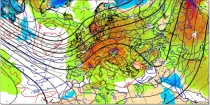
In the northern hemisphere the air rotates anti-clockwise around low contour centres and clockwise around the high contour centres. In the southern hemisphere the air rotates clockwise around low contour centres and ...
Interval/period: N/A
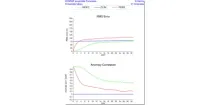
These diagrams compare scores of ensemble control (red) and ensemble members (central 50% of ...
Interval/period: N/A
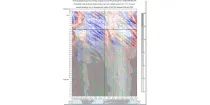
This is a time/longitude diagram (Hovmoller diagram) of 500 hPa or 1000 hPa mean height anomaly ...
Interval/period: N/A