
Datasets
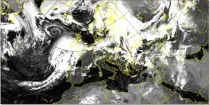
Simulated visible images show simulations of the upward flux of radiation (as would be detected by a weather satellite) derived from information using the model representation of temperatures and cloud layers.
Interval/period: N/A
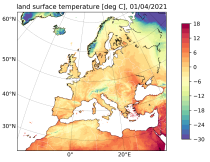
Interval/period: Sat, 09/01/1984 - Thu, 07/31/2025
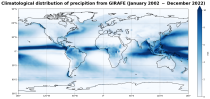
Interval/period: Tue, 01/01/2002 - Sat, 12/31/2022
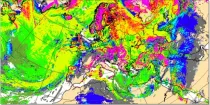
Cloud base height is derived by upwardly searching the structure of the model atmosphere to find the altitude where the cloud fraction becomes >1% and...
Interval/period: N/A
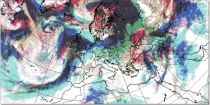
This display helps with the recognition of clouds of different layers, even when they overlap. Brighter colouring represents greater cloud cover. Cloud-free areas appear white while areas of full cloud cover at all levels appear dark grey (e.g. active fronts)...
Interval/period: N/A
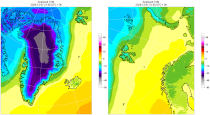
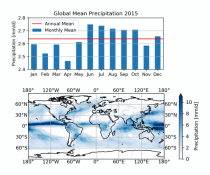
These daily and monthly data are pre-calculated and have the following types depending on the variables: daily and monthly averages, extremes and totals.
Interval/period: Sat, 09/01/1990 - Sat, 02/28/2026
Interval/period: Sat, 01/01/2000 - Sun, 12/31/2017
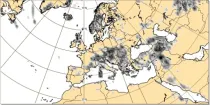
This chart shows probability information regarding visibility near the surface derived from the ...
Interval/period: N/A
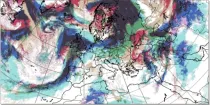
This display helps with the recognition of clouds of different layers, even when they overlap. Brighter colouring represents greater cloud cover. Cloud-free areas appear white while areas of full cloud cover at all levels appear dark grey (e.g. active fronts)...
Interval/period: N/A
Fifth Generation of the European Centre for Medium-Range Weather Forecasts (ECMWF) Reanalysis (ERA5).
Produced by replaying only the land component of the ECMWF ERA5 climate reanalysis, it benefits from the same physical data-assimilation framework but runs offline at
higher spatial detail (9 km grid) to deliver richer land-surface information.
Interval/period: Sun, 01/01/1950 - Thu, 12/31/2026
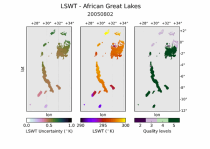
Interval/period: Thu, 06/01/1995 - Thu, 08/27/2026
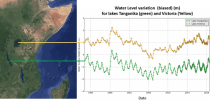
Interval/period: Wed, 01/01/1992 - Thu, 08/27/2026
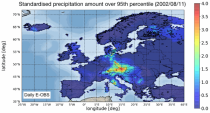
Interval/period: Sun, 01/01/1950 - Tue, 12/31/2019
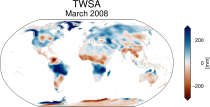
Interval/period: Thu, 04/04/2002 - Tue, 04/01/2025
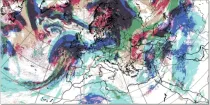
This display helps with the recognition of clouds of different layers, even when they overlap. Brighter colouring represents greater cloud cover. Cloud-free areas appear white while areas of full cloud cover at all levels appear dark grey (e.g. active fronts)...
Interval/period: N/A
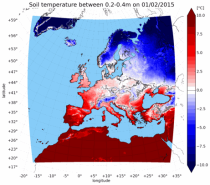
combined with observations using the UERRA-HARMONIE system and MESCAN-SURFEX system.
UERRA-HARMONIE is a 3-dimensional data assimilation system, whereas
MESCAN-SURFEX is a complementary surface analysis system. In general, the
assimilation systems are able to estimate biases between observations and to
sift good-quality data from poor data. The laws of physics allow for estimates
Interval/period: Thu, 10/18/2018 - Wed, 07/31/2019
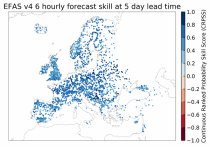
River discharge
Volumetric soil moisture
Snow water equivalent
Soil wetness index (root zone)
Runoff water equivalent (surface plus subsurface)
Interval/period: Wed, 10/14/2020 - Thu, 08/27/2026
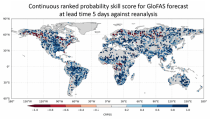
Interval/period: Sun, 01/03/1999 - Sat, 11/25/2023
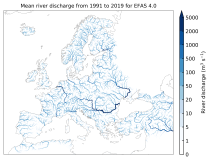
This dataset provides gridded modelled hydrological time series forced with medium-range meteorological forecasts. The data is a consistent representation of the most important hydrological variables across the European Flood Awareness System (EFAS) domain. The temporal resolution is sub-daily high-resolution and ensemble forecasts of:
River discharge
Soil moisture for three soil layers
Snow water equivalent
Interval/period: N/A
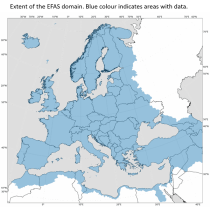
River discharge
Volumetric soil moisture
Snow water equivalent
Soil wetness index (root zone)
Runoff water equivalent (surface plus subsurface)
Interval/period: Fri, 01/01/1999 - Thu, 08/27/2026
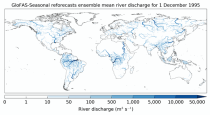
Interval/period: Thu, 01/01/1981 - Sat, 07/01/2023
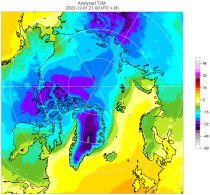
Interval/period: Tue, 10/01/1985 - Wed, 12/31/2025
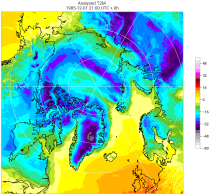
Interval/period: Sun, 09/01/1985 - Wed, 12/31/2025
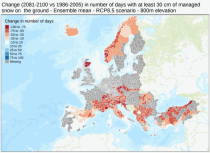
Interval/period: Sun, 01/01/1950 - Fri, 01/01/2100
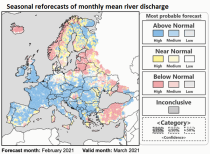
Interval/period: Fri, 01/01/2021 - Thu, 08/27/2026