Datasets

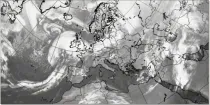
This display helps with the recognition of clouds of different layers, even when they overlap. Brighter colouring represents greater cloud cover. Cloud-free areas appear white while areas of full cloud cover at all levels appear dark grey (e.g. active fronts)...
Interval/period: N/A
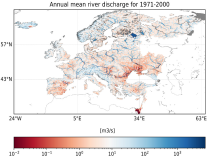
Interval/period: Sun, 01/01/1950 - Fri, 12/31/2100
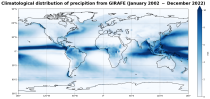
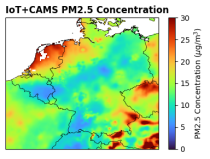
Interval/period: Tue, 01/01/2002 - Sat, 12/31/2022
Interval/period: Sun, 01/01/1950 - Tue, 05/12/2026
Interval/period: Sun, 01/01/1978 - Wed, 10/17/2018
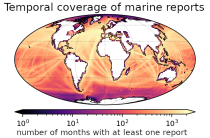
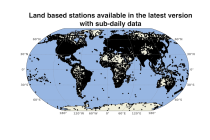
and naval ships, drifting buoys and other platforms and vessels over
the global ocean. Data have been collated and harmonised and quality control checks have been performed, but no attempt
has been made to assess or correct for potential biases.
Data are provided for a range of commonly observed variables.
Interval/period: Tue, 01/01/1850 - Tue, 05/12/2026
Interval/period: Sun, 01/01/1860 - Mon, 12/31/2300
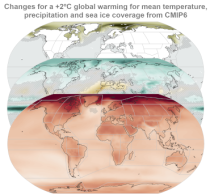
Interval/period: Sun, 01/01/1860 - Mon, 12/31/2300
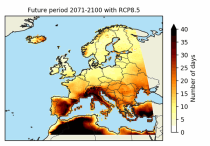
These heat wave and cold spell days are available for different future time periods and use different climate change scenarios.
Interval/period: Wed, 01/01/1986 - Mon, 12/31/2085
Interval/period: Mon, 01/01/2018 - Tue, 12/31/2024
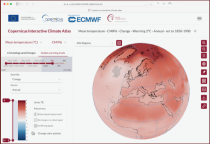
ECV datasets provide the empirical evidence needed to understand the current climate and predict future changes.
Interval/period: N/A

Interval/period: Sun, 01/01/2017 - Fri, 05/01/2026

Interval/period: Sun, 01/01/2017 - Fri, 05/01/2026

Interval/period: Thu, 01/01/1981 - Fri, 05/01/2026

Interval/period: Thu, 01/01/1981 - Fri, 05/01/2026
Interval/period: Thu, 01/01/1981 - Fri, 05/01/2026

Interval/period: Thu, 01/01/1981 - Fri, 05/01/2026
850 hPa wet-bulb potential temperature is commonly used to identify air masses and a strong gradient of wet bulb potential temperature is indicative of fronts between two different air masses...
Interval/period: N/A

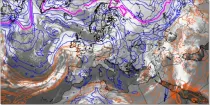
The simulated water vapour images generally focus on the upper troposphere. These charts can often indicate dynamical forcing mechanisms (responsible for cyclogenesis) or convective development (related to potential instability)...
Interval/period: N/A
These products display cloud-related fields from the model in a format that is very familiar to forecasters and that they are used to interpreting. They can easily be compared to actual satellite imagery...
Interval/period: N/A

The simulated water vapour images generally focus on the upper troposphere. These charts can often indicate dynamical forcing mechanisms (responsible for cyclogenesis) or convective development (related to potential instability)...
Interval/period: N/A