Datasets

Simulated visible images show simulations of the upward flux of radiation (as would be detected by a weather satellite) derived from information using the model representation of temperatures and cloud layers.
Interval/period: N/A
Interval/period: Sat, 09/01/1984 - Thu, 07/31/2025
Interval/period: N/A
Interval/period: Sun, 01/01/1950 - Wed, 12/01/2100
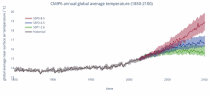
Interval/period: Sun, 01/01/1860 - Mon, 12/31/2300
Interval/period: Sat, 01/01/1949 - Sun, 07/05/2026
Interval/period: Sun, 01/01/1950 - Fri, 12/31/2100
Interval/period: Tue, 01/01/2002 - Sat, 12/31/2022
Interval/period: Mon, 01/01/1940 - Fri, 12/31/2100

Cloud base height is derived by upwardly searching the structure of the model atmosphere to find the altitude where the cloud fraction becomes >1% and...
Interval/period: N/A
Interval/period: Sun, 01/01/1860 - Mon, 12/31/2300
Interval/period: Wed, 01/01/1800 - Fri, 12/31/2100
Interval/period: Sun, 01/01/1860 - Mon, 12/31/2300
Interval/period: Sun, 01/01/1860 - Mon, 12/31/2300
CMIP6 data underpins the Intergovernmental Panel on Climate Change 6th Assessment Report. The use of these data is mostly aimed at:
addressing outstanding scientific questions that arose as part of the IPCC reporting process;
improving the understanding of the climate system;
Interval/period: Sun, 01/01/1860 - Mon, 12/31/2300
Interval/period: Sun, 01/01/1950 - Sun, 07/05/2026

This display helps with the recognition of clouds of different layers, even when they overlap. Brighter colouring represents greater cloud cover. Cloud-free areas appear white while areas of full cloud cover at all levels appear dark grey (e.g. active fronts)...
Interval/period: N/A
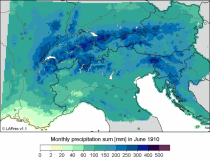
LAPrec1871 starts in 1871 and is based on data from 85 input series;
LAPrec1901 starts in 1901 and is based on data from 165 input series.
Interval/period: Sun, 01/01/1871 - Sun, 07/05/2026
These daily and monthly data are pre-calculated and have the following types depending on the variables: daily and monthly averages, extremes and totals.
Interval/period: Sat, 09/01/1990 - Sat, 02/28/2026
Interval/period: Sat, 01/01/2000 - Sun, 12/31/2017

This chart shows probability information regarding visibility near the surface derived from the ...
Interval/period: N/A

This display helps with the recognition of clouds of different layers, even when they overlap. Brighter colouring represents greater cloud cover. Cloud-free areas appear white while areas of full cloud cover at all levels appear dark grey (e.g. active fronts)...
Interval/period: N/A
ECV datasets provide the empirical evidence needed to understand the current climate and predict future changes.
CIIs contain condensed climate information which facilitate relatively quick and efficient subsequent analysis. Therefore, CIIs make climate information accessible to application focussed users within a sector.
Interval/period: N/A
Interval/period: Thu, 01/01/1750 - Fri, 01/01/2021
Interval/period: Wed, 01/01/1986 - Mon, 12/31/2085