Datasets

This chart provides information on the verification of forecasts of Accumulated Cyclone Energy ...
Interval/period: N/A

The ECMWF seasonal forecasts (SEAS5) are produced every month with a 51-member ensemble at a ...
Interval/period: N/A

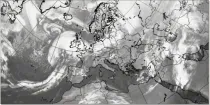
Simulated visible images show simulations of the upward flux of radiation (as would be detected by a weather satellite) derived from information using the model representation of temperatures and cloud layers.
Interval/period: N/A
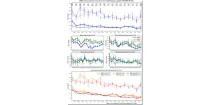
The diagram shows mean errors in position and intensity of tropical cyclones for HRES and ENS. ...
Interval/period: N/A

This display helps with the recognition of clouds of different layers, even when they overlap. Brighter colouring represents greater cloud cover. Cloud-free areas appear white while areas of full cloud cover at all levels appear dark grey (e.g. active fronts)...
Interval/period: N/A

This chart shows probability information regarding visibility near the surface derived from the ...
Interval/period: N/A

The ECMWF seasonal forecasts (SEAS5) are produced every month with a 51-member ensemble at a ...
Interval/period: N/A
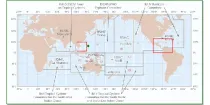
These charts provide information on current Tropical Cyclone activity. Select the ...
Interval/period: N/A
This chart shows the potential for tropical cyclone activity at different time ranges during the ...
Interval/period: N/A

The ECMWF seasonal forecasts (SEAS5) are produced every month with a 51-member ensemble at a ...
Interval/period: N/A

The ECMWF seasonal forecasts (SEAS5) are produced every month with a 51-member ensemble at a ...
Interval/period: N/A

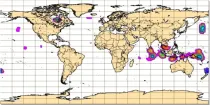
The charts show mean frequency and accumulated cyclone energy of tropical storm activity. ...
Interval/period: N/A

This chart provides information on the verification of forecasts of the expected number of ...
Interval/period: N/A

The charts show the evolution of existing and potential tropical cyclone activity. ...
Interval/period: N/A

This display helps with the recognition of clouds of different layers, even when they overlap. Brighter colouring represents greater cloud cover. Cloud-free areas appear white while areas of full cloud cover at all levels appear dark grey (e.g. active fronts)...
Interval/period: N/A

Cloud base height is derived by upwardly searching the structure of the model atmosphere to find the altitude where the cloud fraction becomes >1% and...
Interval/period: N/A

This display helps with the recognition of clouds of different layers, even when they overlap. Brighter colouring represents greater cloud cover. Cloud-free areas appear white while areas of full cloud cover at all levels appear dark grey (e.g. active fronts)...
Interval/period: N/A

The ECMWF seasonal forecasts (SEAS5) are produced every month with a 51-member ensemble at a ...
Interval/period: N/A

This chart provides information on the verification of forecasts of the number of tropical ...
Interval/period: N/A
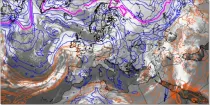
850 hPa wet-bulb potential temperature is commonly used to identify air masses and a strong gradient of wet bulb potential temperature is indicative of fronts between two different air masses...
Interval/period: N/A

The simulated water vapour images generally focus on the upper troposphere. These charts can often indicate dynamical forcing mechanisms (responsible for cyclogenesis) or convective development (related to potential instability)...
Interval/period: N/A
These products display cloud-related fields from the model in a format that is very familiar to forecasters and that they are used to interpreting. They can easily be compared to actual satellite imagery...
Interval/period: N/A

The simulated water vapour images generally focus on the upper troposphere. These charts can often indicate dynamical forcing mechanisms (responsible for cyclogenesis) or convective development (related to potential instability)...
Interval/period: N/A